Guide to Unsupervised Machine Learning: 7 Real Life Examples
The effective use of information is one of the prime requirements for any kind of business operation. At some point, the amount of data produced goes beyond simple processing capacities. That’s where machine learning algorithms kick in.
However, before any of it could happen – the information needs to be explored and made sense of. That is what unsupervised machine learning is for in a nutshell.
We had talked about supervised ML algorithms in the previous article. In this one, we’ll focus on unsupervised ML and its real-life applications.
What is unsupervised machine learning?
Unsupervised learning is a type of machine learning algorithm that brings order to the dataset and makes sense of data.
Unsupervised machine learning algorithms are used to group unstructured data according to its similarities and distinct patterns in the dataset.
The term “unsupervised” refers to the fact that the algorithm is not guided like a supervised learning algorithm.
How does an unsupervised ML algorithm work?
The unsupervised algorithm is handling data without prior training – it is a function that does its job with the data at its disposal. In a way, it is left at his own devices to sort things out as it sees fit.
The unsupervised algorithm works with unlabeled data. Its purpose is exploration. If supervised machine learning works under clearly defines rules, unsupervised learning is working under the conditions of results being unknown and thus needed to be defined in the process.
The unsupervised machine learning algorithm is used to:
- Explore the structure of the information and detect distinct patterns;
- Extract valuable insights;
- Implement this into its operation in order to increase the efficiency of the decision-making process
In other words, it describes information – go through the thick of it and identifies what it really is.
In order to make that happen, unsupervised learning applies two major techniques – clustering and dimensionality reduction.
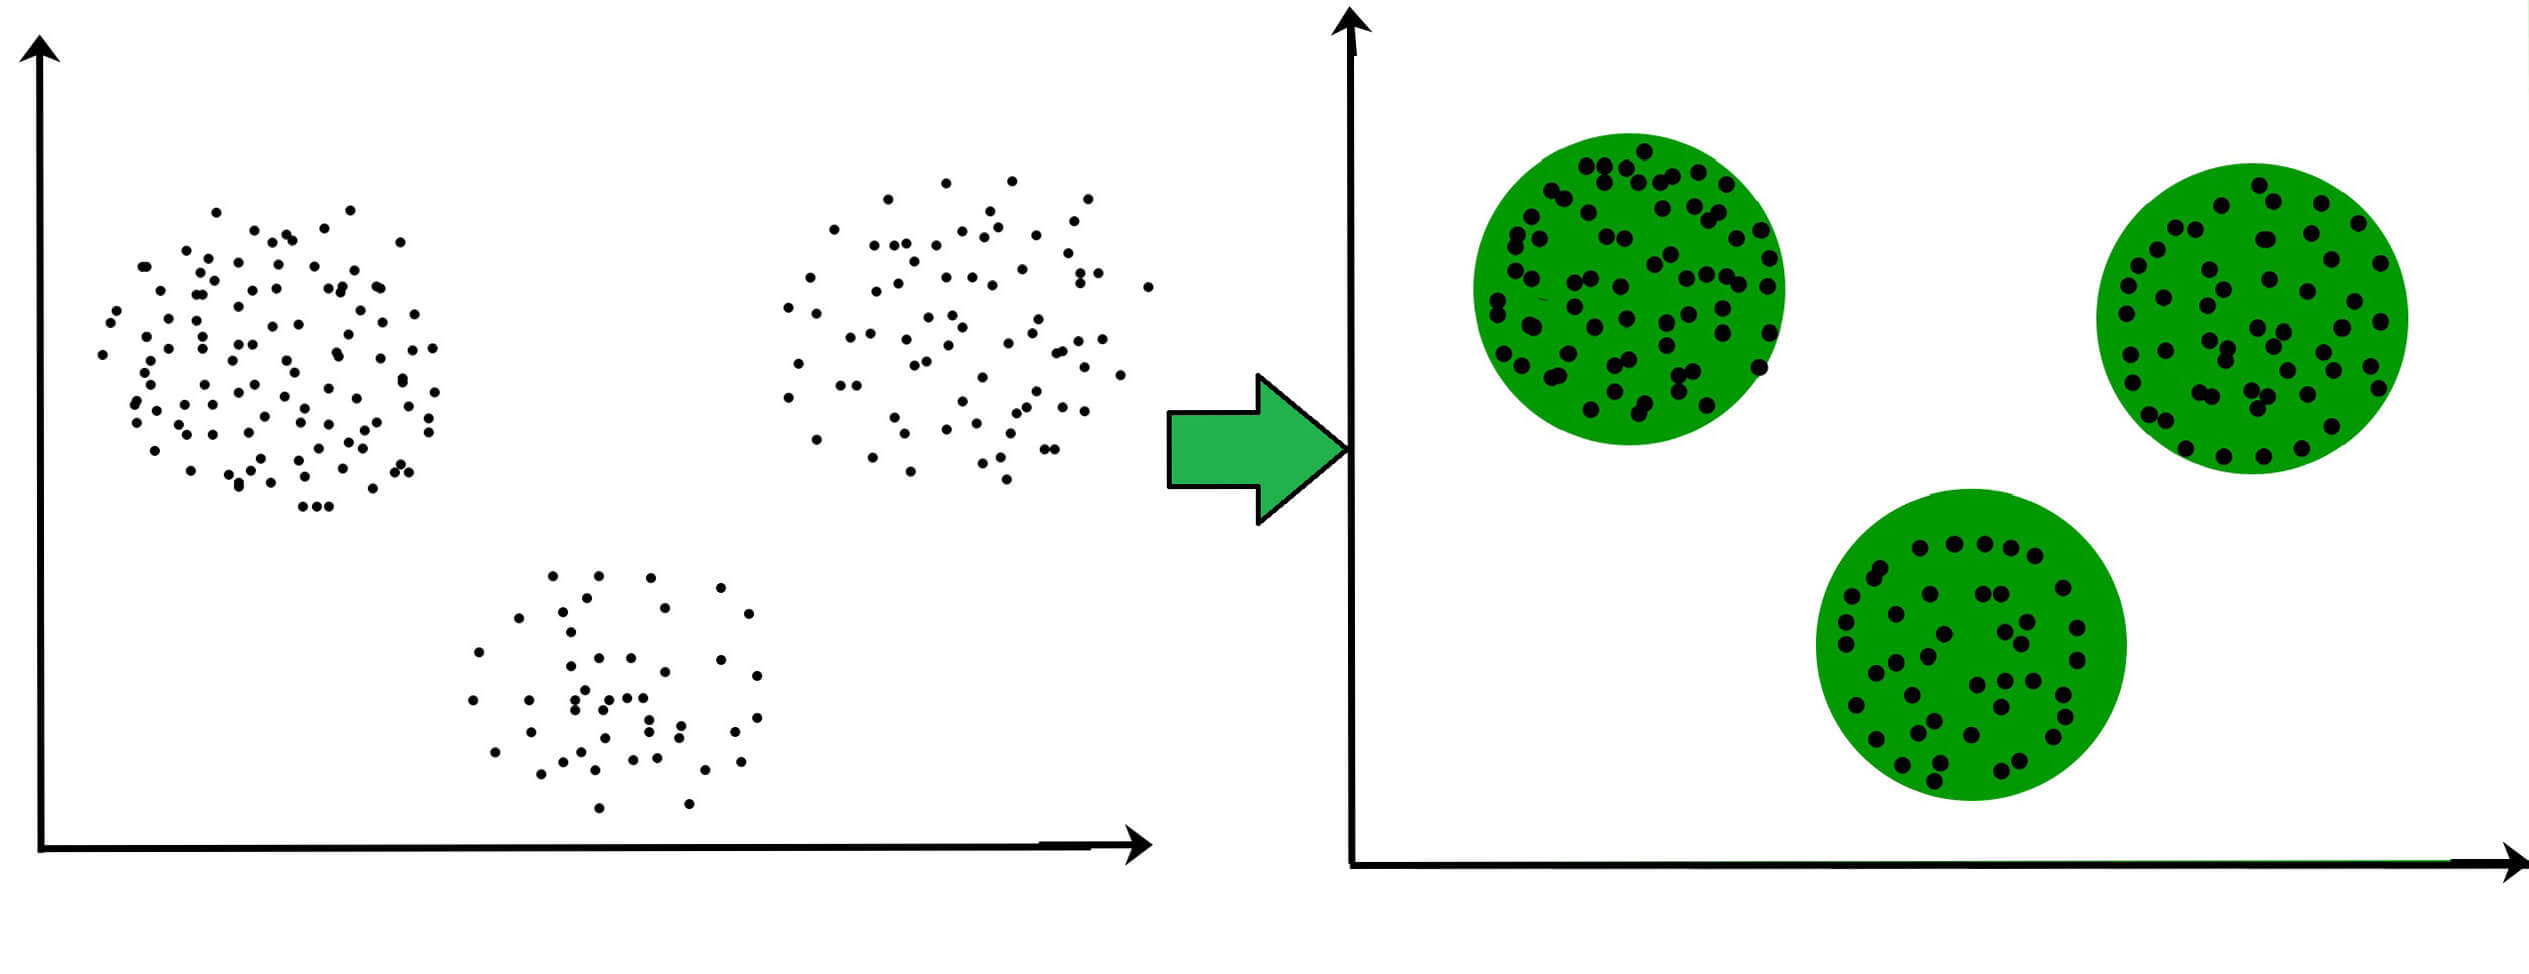
Clustering – Exploration of Data
“Clustering” is the term used to describe the exploration of data, where similar pieces of information are grouped. There are several steps to this process:
- Defining the credentials that form the requirement for each cluster. The credentials are then matched with the processed data and thus the clusters are formed.
- Breaking down the dataset into specific groups (known as clusters) based on their common features.
Clustering techniques are simple yet effective. They require some intense work yet can often give us some valuable insight into the data.
[Source]
Clustering has been widely used across industries for years:
- Biology – for genetic and species grouping;
- Medical imaging – for distinguishing between different kinds of tissues;
- Market research – for differentiating groups of customers based on some attributes
- Recommender systems – giving you better Amazon purchase suggestions or Netflix movie matches.
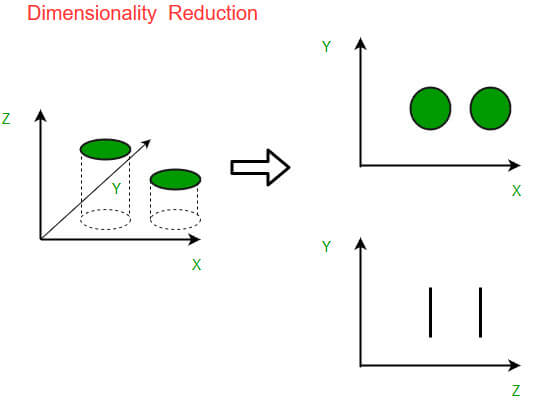
Dimensionality Reduction – Making Data Digestible
In a nutshell, dimensionality reduction is the process of distilling the relevant information from the chaos or getting rid of the unnecessary information.
Raw data is usually laced with a thick layer of data noise, which can be anything – missing values, erroneous data, muddled bits, or something irrelevant to the cause. Because of that, before you start digging for insights, you need to clean the data up first. Dimensionality reduction helps to do just that.
[Source]
From the technical standpoint – dimensionality reduction is the process of decreasing the complexity of data while retaining the relevant parts of its structure to a certain degree.
7 Unsupervised Machine Learning Real Life Examples
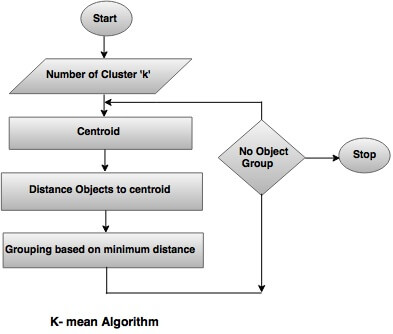
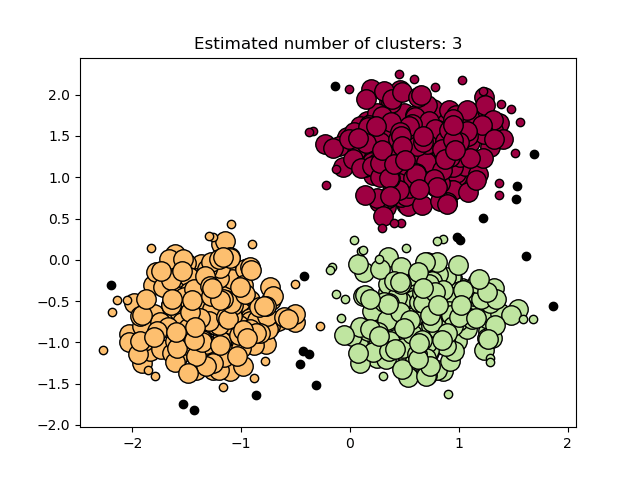
k-means Clustering – Data Mining
k-means clustering is the central algorithm in unsupervised machine learning operations. It is the algorithm that defines the features present in the dataset and groups certain bits with common elements into clusters.
[Source]
As such, k-means clustering is an indispensable tool in the data-mining operation. It is also used for:
- Audience segmentation
- Customer persona investigation
- Anomaly detection (for example, to detect bot activity)
- Pattern recognition (grouping images, transcribing audio)
- Inventory management (by conversion activity or by availability)
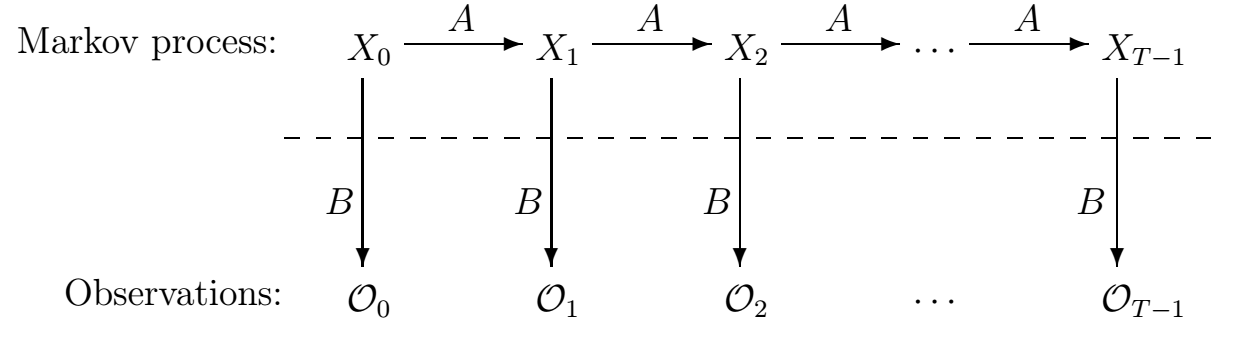
Hidden Markov Model – Pattern Recognition, Natural Language Processing, Data Analytics
Another example of unsupervised machine learning is the Hidden Markov Model. It is one of the more elaborate ML algorithms – a statical model that analyzes the features of data and groups it accordingly.
[Source]
Hidden Markov Model is a variation of the simple Markov chain that includes observations over the state of data, which adds another perspective on the data gives the algorithm more points of reference.
Hidden Markov Model real-life applications also include:
- Optical Character recognition (including handwriting recognition)
- Speech recognition and synthesis (for conversational user interfaces)
- Text Classification (with parts-of-speech tagging)
- Text Translation
Hidden Markov Models are also used in data analytics operations. In that field, HMM is used for clustering purposes. It finds the associations between the objects in the dataset and explores its structure. Usually, HMM are used for sound or video sources of information.
Need help in developing your App?
Reach outDBSCAN Clustering – Customer Service Personalization, Recommender engines
DBSCAN Clustering AKA Density-based Spatial Clustering of Applications with Noise is another approach to clustering. It is commonly used in data wrangling and data mining for the following activities:
- Explore the structure of the information
- Find common elements in the data
- Predict trends coming out of data
Overall, DBSCAN operation looks like this:
- The algorithm groups data points that are close to each other.
- Then it sorts the data according to the exposed commonalities
[Source]
DBSCAN algorithms are used in the following fields:
- Targeted Ad Content Inventory Management
- Customer service personalization
- Recommender Engines
I want a free consultation for my project
Contact UsPrincipal component analysis (PCA) – Data Analytics Visualization / Fraud Detection
PCA is the dimensionality reduction algorithm for data visualization. It is a sweet and simple algorithm that does its job and doesn’t mess around. In the majority of cases is the best option.
In its core, PCA is a linear feature extraction tool. It linearly maps the data about the low-dimensional space.
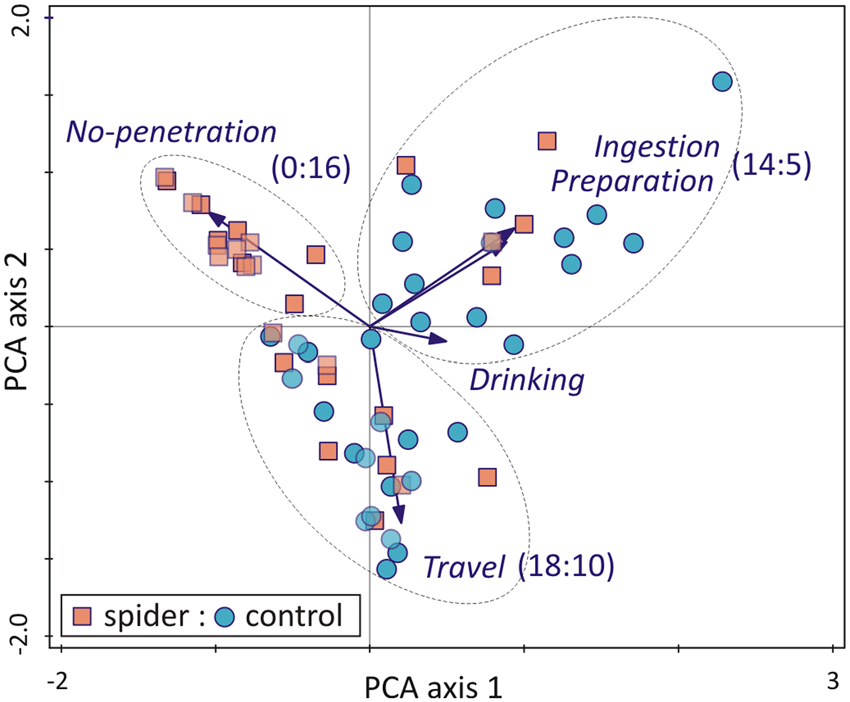
[Source]
PCA combines input features in a way that gathers the most important parts of data while leaving out the irrelevant bits.
As a visualization tool – PCA is useful for showing a bird’s eye view on the operation. It can be an example of an excellent tool to:
- Show the dynamics of the website traffic ebbs and flows.
- Break down the segments of the target audience on specific criteria
t-SNE – Data Analytics Visualization
t-SNE AKA T-distributed Stochastic Neighbor Embedding is another go-to algorithm for data visualization.
t-SNE uses dimensionality reduction to translate high-dimensional data into low-dimensional space. In other words, show the cream of the crop of the dataset.
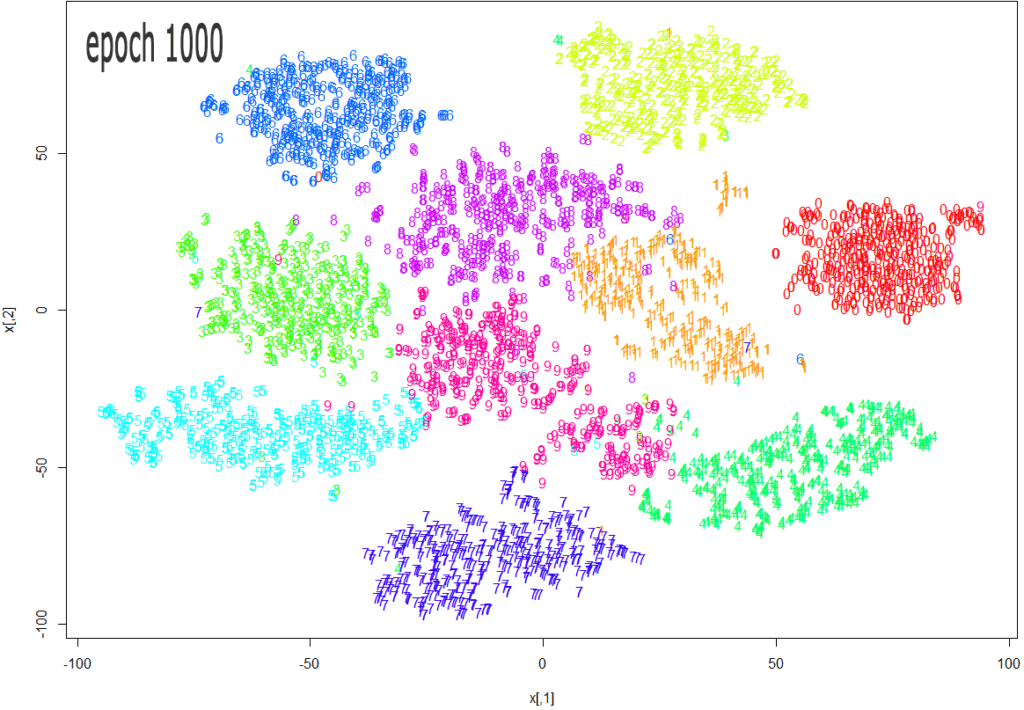
[Source]
The whole process looks like this:
- The algorithm counts the probability of similarity of the points in a high-dimensional space.
- Then it does the same thing in the corresponding low-dimensional space.
- After that, the algorithm minimizes the difference between conditional probabilities in high-dimensional and low-dimensional spaces for the optimal representation of data points in a low-dimensional space.
As such, t-SNE is good for visualizing more complex types of data with many moving parts and everchanging characteristics. For example, t-SNE is good for:
- Genome visualization in genomics application
- Medical test breakdown (for example, blood test or operation stats digest)
- Complex audience segmentation (with highly detailed segments and overlapping elements)
Singular value decomposition (SVD) – Recommender Systems
Singular value decomposition is a dimensionality reduction algorithm used for exploratory and interpreting purposes.
It is an algorithm that highlights the significant features of the information in the dataset and puts them front and center for further operation. Case in point – making consumer suggestions, such as which kind of shirt and shoes fit best with those ragged Levi’s jeans.
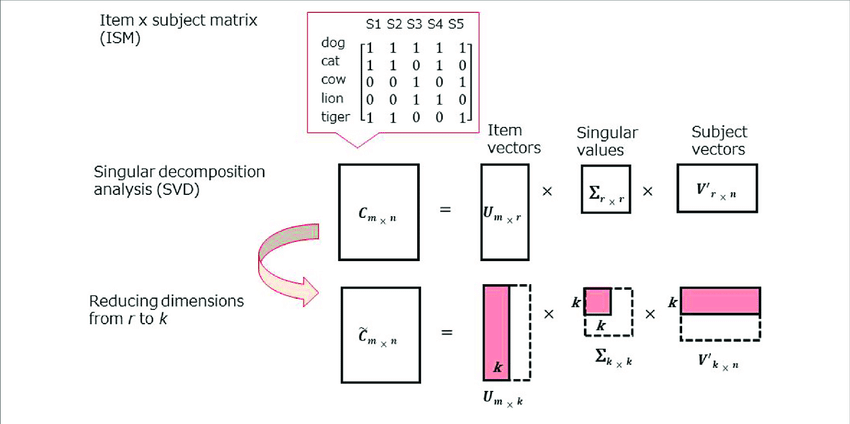
[Source]
In a nutshell, it sharpens the edges and turns the rounds into tightly fitting squares. In a way, SVD is reappropriating relevant elements of information to fit a specific cause.
SVD can be used:
- To extract certain types of information from the dataset (for example, take out info on every user located in Tampa, Florida).
- To make suggestions for a particular user in the recommender engine system.
- To curate ad inventory for a specific audience segment during real-time bidding operation.
Association rule – Predictive Analytics
Association rule is one of the cornerstone algorithms of unsupervised machine learning.
It is a series of techniques aimed at uncovering the relationships between objects. This provides a solid ground for making all sorts of predictions and calculating the probabilities of certain turns of events over the other.
While association rules can be applied almost everywhere, the best way to describe what exactly they are doing are via eCommerce-related example.
There are three major measure applied in association rule algorithms
- Support measure shows how popular the item is by the proportion of transaction in which it appears.
- Confidence measure shows the likeness of Item B being purchased after item A is acquired.
- Lift measure also shows the likeness of Item B being purchased after item A is bought. However, it adds to the equation the demand rate of Item B.
Conclusion
The secret of gaining a competitive advantage in the specific market is in the effective use of data. Unsupervised machine learning algorithms help you segment the data to study your target audience’s preferences or see how a specific virus reacts to a specific antibiotic.
Real-life applications abound and our data scientists, engineers, and architects can help you define your expectations and create custom ML solutions for your business.
Need help in developing your App?
Reach out