The backstory
Wildfires are one of those natural disasters we cannot control. However, by applying modern technologies, we have a chance to predict them and reduce the consequences for both individuals and businesses.
We want to share our experience of working on GlideFinder, a platform that uses images from NASA satellites to analyze information about wildfires in real-time, and alert people nearby.
Once we got an email from Dmitry Kryuk, GlideFinder Founder and CTO, who was looking for experienced Google Cloud developers. He wanted us to improve the product by making several changes to the product’s architecture. In particular, he needed to integrate streaming data analytics tools and connect additional NASA satellites for more accurate and precise wildfire information.
How does it work
GlideFinder is a platform that locates wildfires, alerts subscribers, and provides analytics on time. Initially, GlideFinder was developed for the California region, where fires are especially dangerous and annually destroy hundreds of homes, resulting in multi-billion dollar damages, business bankruptcies, and lives lost. Now, the company wants to help people all over the world to reduce the consequences of wildfires.
The GlideFinder platform leverages both historical and real-time data sources. For real-time alerts, the platform gathers data from:
- NASA’s Suomi NPP (National Polar-orbiting Partnership) satellite
- VIIRS (Visible Infrared Imaging Radiometer Suite) satellite
To make predictions about the spread of wildfires, the product analyses data from:
- Historical NASA MODIS/VIIRS fire data gathered during the previous 17 years
- The US Fire Administration database
- United States Census Bureau’s data
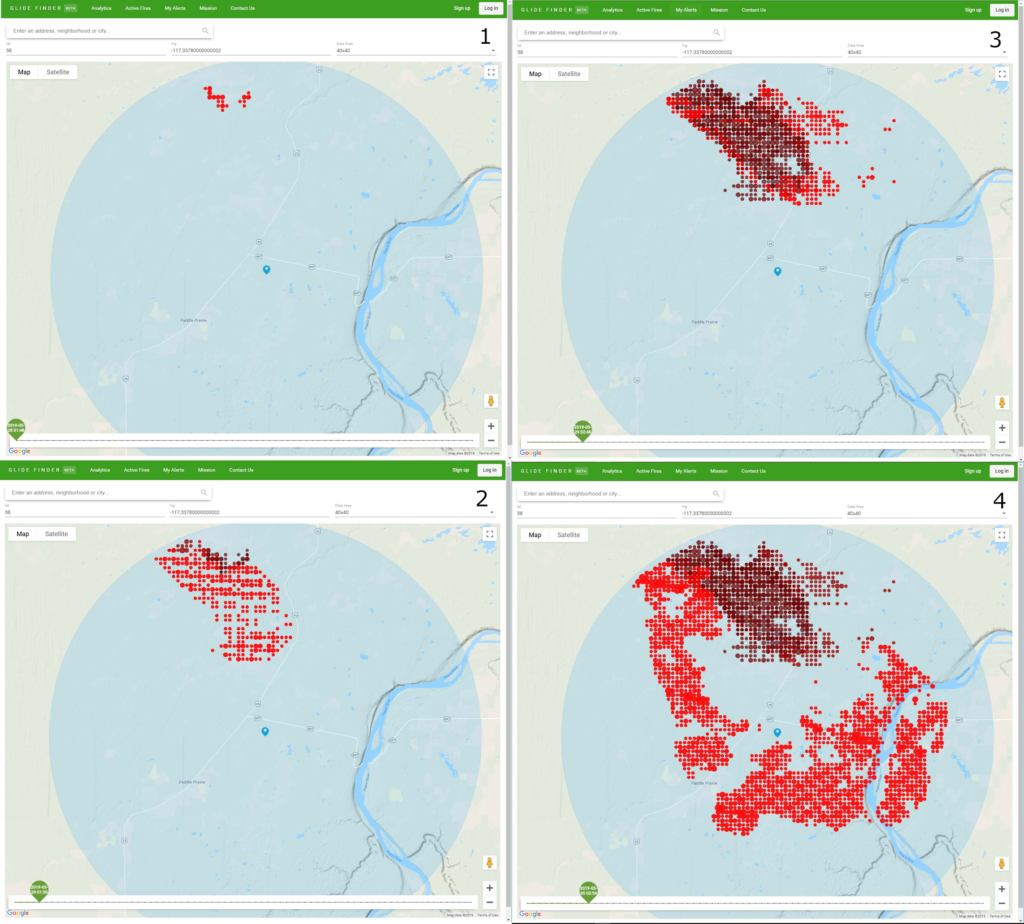
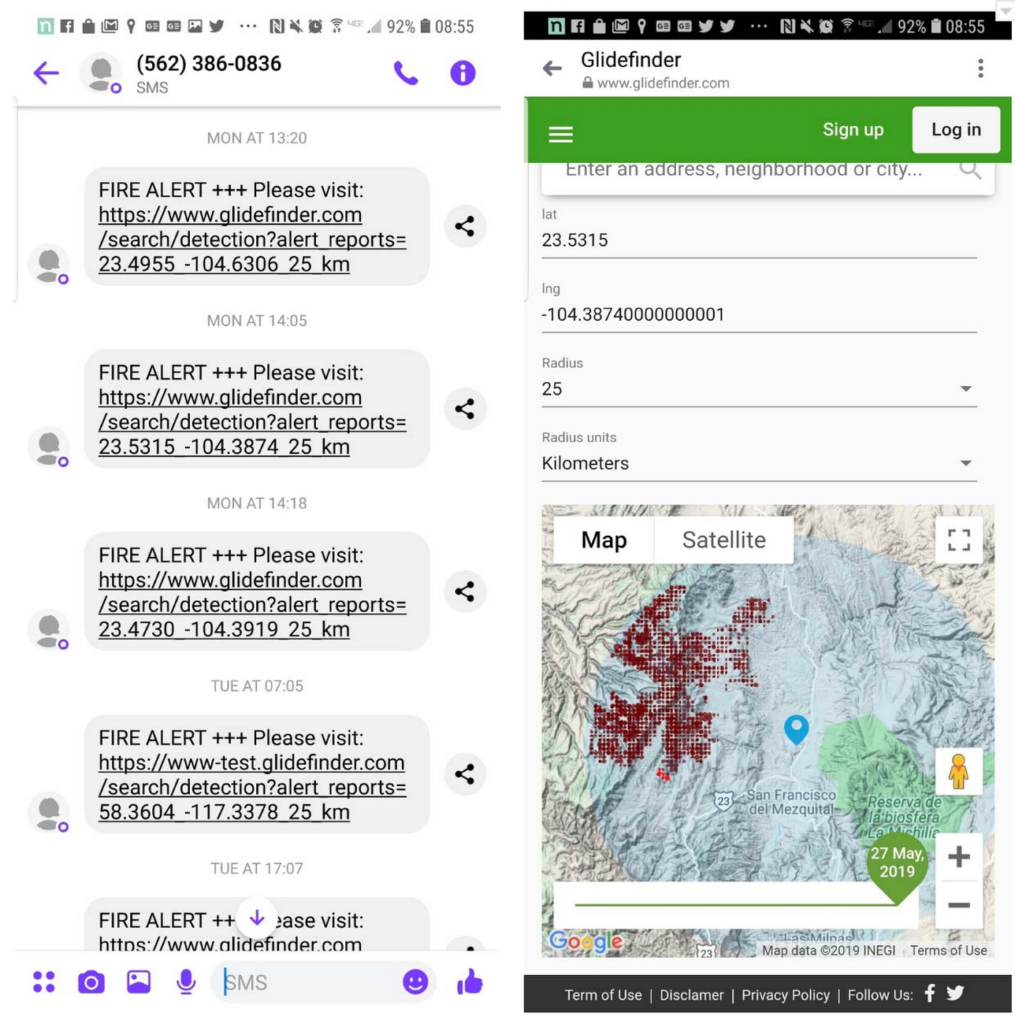
Once GlideFinder detects a wildfire, it alerts users about the danger via SMS. Users can also monitor the fire’s movement, direction, speed, and size on real-time maps integrated to the GlideFinder website.
GlideFinder users can also see how far the wildfire is from their homes, their children’s school, parents’ homes, and offices.
Most of the data analytics happens on the Google Cloud Platform, which reduces latency and provides all the necessary data analytics tools.
Client Requirements
Dmitry needed a team to upgrade the product. For this task, he had the following requirements:
- Integrate streaming data analytics. Since the main project’s architecture operated on batch data processing, we needed to upgrade it so that the product could better perform real-time data analytics.
- Integrate additional Geostationary Operational Environmental Satellites (GOES-16 and GOES-17) that will run new scans every 5-15 minutes so that the platform can receive more detailed information about a wildfire. But also, the platform can merge the satellite data into a particular format. So, we needed to configure data preparation with geospatial transformations.
Our solution and the obstacles we faced
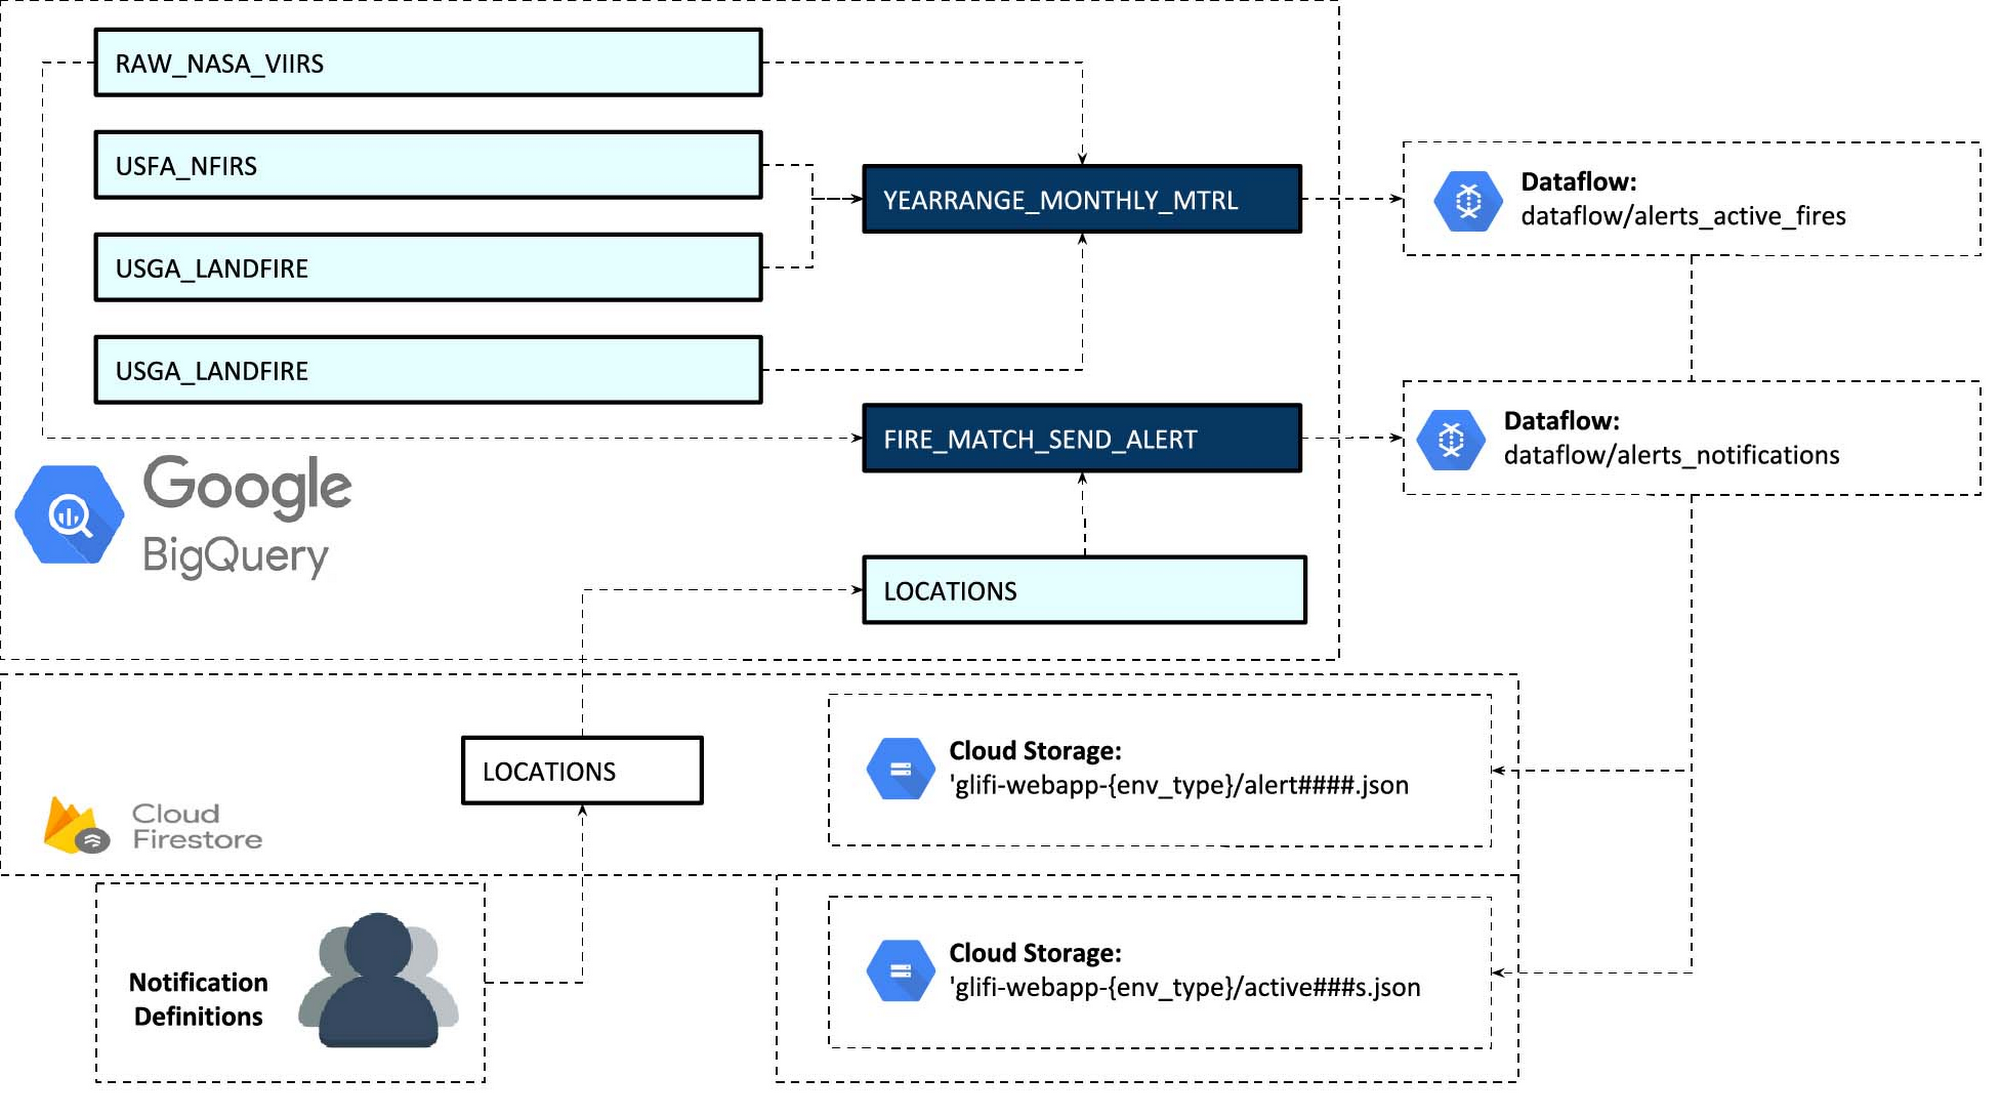
To integrate streaming data analytics, we developed an ETL (extract, transform, load) pipeline that builds on Google Cloud components such as Dataflow, PubSub, Cloud Functions, BigQuery, etc. We also materialized the views with the required business logic and used a Dataflow job to process that data and write into JSON files in Cloud Storage and Cloud Firestore.
During Data Flow integration, we needed to use Python SDK, because the entire architecture was developed using this programming language. Since Python architecture is less documented (unlike Java, which we apply more often), we dedicated a significant amount of time on the investigation process.
To add open-source geostationary operational environmental satellites, we had to dig deeper into how to work with geo-data, so we conducted further research. We took images received from the satellite and split them into geographical zones using geospatial transformations.
At this stage, we also applied to the Geospatial Data Abstraction Library, a computer software library for reading and writing raster and vector geospatial data formats.
It took us about four months to complete all these tasks.
How we did it
For this project, we created new Buckets (essential containers that hold the project’s data) on Google Cloud Storage. Then, to upgrade the product’s infrastructure, we gradually migrated batch data components to streaming infrastructure.
The integration of GOES-16 and GOES-17 took us through the following actions:
- Communicated with National Oceanic and Atmospheric Administration engineers and asked them to mirror GOES satellite data into the GCS buckets
- Connected Glidefinder ETL system to the GOES GCS notifications
- Processed GOES historical data
- Stored GOES historical data into BigQuery datasets
- Added Dataflow Streaming processing of GOES data
- Added geospatial transformations to align GOES data with satellite data (like VIIRS) already collected
Our tech stack
Google Cloud Components:
- Dataflow
- PubSub
- Functions
- Storage
- BigQuery
- Firestore
- CloudBuild
- AppEngine
Language:
- Python
- JavaScript
Documentation:
- GDAL documentation
- netCDF4 API documentation
Team composition
- 1 Project Manager
- 2 Data scientists

Results
We empowered GlideFinder with a new infrastructure best suited for streaming data analytics. We also integrated geostationary satellites GOES-16 and GOES-17 that make new scans every 5-15 minutes, so the platform’s users can receive even more relevant data about nearby wildfires. You can try the platform on the link.
We are proud to have participated in GlideFinder’s development because we had the unique opportunity, not only to enhance our Google Cloud Platform expertise, but also to help others save lives.