PODCAST #14. How to Excel in Strategic Planning for Effective Product Management: Tips from an Industry Expert

During this episode of our Careminds podcast, we discuss the complexities of product management and go-to-market strategies with our guest, Donna Cichani. Donna has a background in product management, A/B testing, and data analysis, and has worked with notable organizations such as Johns Hopkins Medicine, KPMG US, and JP Morgan. Currently, she is the lead product manager at Heal.

Our conversation with Donna covers topics like data analysis and strategic product planning, the differing mindsets between 0 to 1 and one to end product development, and methods to increase user engagement and product optimization. Drawing from her diverse experience in industries like healthcare, technology, banking, and finance, Donna shares her thoughts on the importance of strategic planning in product management.

Defining Success Criteria for Product Stages

When determining the success of a product, you consider both the user perspective and the business perspective. Using the example of an RPM solution called Pulse, designed for chronic disease management at Heal, we can explore the key performance indicators (KPIs) and metrics that matter most.

Firstly, there are patient-centric KPIs that focus on adoption and usage. Monitoring how often users engage with the solution to record their vitals and biometrics is crucial. The main goal is to encourage patients to stay proactive in managing their chronic conditions by using the solution more frequently.

User centricity is key, focusing on how you are improving life and the experience for the end user.

Secondly, clinical outcomes are also important. By tracking improvements in specific health measures, such as A1C levels for diabetic patients or maintaining healthy blood pressure ranges for hypertensive patients, we can gauge the effectiveness of the solution in promoting better health.

Also, business KPIs, such as attribution, play a significant role. For the RPM solution, it is important to know what percentage of patients using the solution are attributed to Heal for their primary care doctors.

Defining the best approach for optimizing a product depends on the specific product and its maturity curve. Take, for example, the RPM solution mentioned earlier. The primary goal of any RPM solution is to encourage users to engage with it consistently and measure their biometrics routinely.

At one point, the team behind the RPM solution considered expanding its features to include medication refill reminders, envisioning a more comprehensive ecosystem for patient monitoring. However, they quickly recognized the importance of perfecting their core RPM capabilities before adding secondary features. By maintaining focus on their core competency, they ensured they wouldn’t dilute the solution’s main purpose.

Optimization often involves considering the user experience, especially when it comes to healthcare solutions. In the case of the RPM solution, refining its core features contributed significantly to increased patient engagement. This example highlights the importance of prioritizing the optimization of a product’s primary functions before expanding its scope.

When to Focus on New Features or Enhancements in Product Development

You should invest heavily in user research as it’s crucial for driving customer adoption and engagement. During the discovery phase, our team spent considerable time observing patients in their natural environments, using existing products like glucometers, and capturing their day-to-day experiences. This research also included understanding how nurses, doctors, and other providers utilized data points during home visits.

By conducting ethnography studies, user research, and interviews, we were able to identify key pain points, which we then translated into enhancements and feature opportunities to drive engagement. To ensure customer adoption, it’s essential to focus on understanding users’ pain points, observe their interactions with your product or similar products, and avoid relying solely on secondary sources or high-level questions.

I don’t think that user research for usability testing ends during the discovery phase.

It’s important to note that user research and usability testing don’t end during the discovery phase. After creating our first prototype, we went through two additional rounds of usability testing to validate our assumptions, identify any flaws in our user flow, and refine the solution iteratively. This process continued up until the launch of the minimum viable product (MVP).

The ability of product managers to remain detached from their original plans, even after investing significant time and effort, is fascinating. When real data no longer supports the initial plan, it’s crucial to let it go, find a new direction, and create a better product that serves users more effectively. This adaptability is an essential aspect of successful product management.

Effective Optimization Techniques & The Best Ways to Apply Them

Optimization techniques focus on understanding existing processes, examining them through the lens of various stakeholders involved in the end-to-end flow, and identifying opportunities for efficiencies. For instance, by analyzing a process that takes 10 days and involves five stakeholders, you can uncover ways to reduce the number of stakeholders or the time each takes to complete their part.

Process mapping, a technique that visually represents the steps involved in a process, helps identify bottlenecks, redundancies, and areas for improvement. A/B testing is another valuable technique, where two different versions of a feature or product are tested with the target audience to determine which performs better.

In my experience, one of the keys to successful optimization is to involve the entire team in the process.

Involving the entire team, including product, engineering, design, sales, and marketing, leads to a more holistic view of challenges and opportunities, ultimately driving better optimization decisions. Keeping the end user in mind is crucial, as the goal is to enhance their experience.

It’s important to acknowledge that the rapid growth of product management as a career has led to a mix of undisputed go-to practices and those still being defined through trial and error. Sharing experiences and learning from others in the community can help navigate this evolving field and contribute to its development.

What Drives a Product Manager: The Exciting Facets of a PM’s Career

Effective management in product management involves three key aspects. First, tailor your approach to the needs of each individual on your team, recognizing that there is no one-size-fits-all solution. Second, invest in the long-term career growth of your team members, extending beyond the scope of your organization, by providing mentorship and opportunities for personal and professional development.

The third aspect involves being able to oversee the work of your team without micromanaging, while still being prepared to jump in and help when necessary. Balancing trust and autonomy with support is essential for successful management.

It’s an exciting time for all the PMs because we are focusing on doing good and building impactful products and services that can make people’s lives better.

In terms of current excitement in the field, AI and machine learning are opening many doors in product management. There’s a rewarding shift in focus in both healthcare and fintech industries. In fintech, increased emphasis on financial literacy and access to banking products for the unbanked population is driving positive change. Meanwhile, healthcare is moving towards value-based care, focusing on preventative measures and overall population health, which reduces costs and the burden on the healthcare system. This is an exciting time for product managers as they work on building impactful products and services that improve people’s lives.

Wrapping Up

As product managers continue to navigate this rapidly evolving field, learning from industry experts like Donna and sharing experiences within the community will be invaluable in driving growth and creating impactful products that make a difference in people’s lives. Key takeaways from our conversation include:

  • Defining success criteria for product stages: It’s crucial to consider both user and business perspectives when determining the success of a product.
  • Focusing on core competencies in optimization: Prioritize optimizing a product’s primary functions before expanding its scope or adding new features.
  • Conducting user research and embracing adaptability: Engage in user research, usability testing, and iterate on your product based on data and feedback, and remain open to change when necessary.
  • Effective management and exciting developments in the field: Tailor your approach to individual team members, invest in their long-term career growth, and maintain a balance between autonomy and support. Embrace the exciting opportunities in AI, machine learning, and the shifting focus of various industries.

WATCH ALSO:

PODCAST #13. The Psychology of Product Management: Unlocking Human Insights & OKRS

PODCAST #12. THE PRODUCT MANAGER’S PATH TO HAELTH TECH INNOVATION: PRODUCT STRATEGY, LEADERSHIP & OKRS

PODCAST #11. THE SKEPTICAL IDEALIST: HOW PRODUCT MANAGERS NAVIGATE HEALTH TECH CHALLENGES

PODCAST #10. WEB 3.0 AND HEALTHCARE: OPPORTUNITIES FOR GROWTH AND COLLABORATION

PODCAST #9. HOW TO SUCCEED IN PRODUCT DEVELOPMENT: ADVICE FROM A PRODUCT MANAGER

***

The APP Solutions launched a podcast, CareMinds, where you can hear from respected experts in healthcare and Health Tech.

Who is a successful product manager in the healthcare domain? Which skills and qualities are crucial? How important is this role in moving a successful business to new achievements? Responsibilities and KPIs?

Please find out about all this and more in our podcast. Stay tuned for updates and subscribe to channels.

Listen to our podcast to get some useful tips on your next startup.

Article podcast YouTube

What is Big Data Analytics? Definition, Types, Software, and Use Cases

You can have all the data in the world, but if you don’t know how to use it for your business benefit, there’s no point in sitting on that raw information and expect good things to happen. The solution – Big Data Analytics – helps to gain valuable insights to give you the opportunity to make business decisions more effectively. 

In a way, data analytics is the crossroads of the business operations. It is the vantage point where you can watch the streams and note the patterns.

But first – let’s explain the basics.

What is Data Analytics?

The term “Data Analytics” describes a series of techniques aimed at extracting relevant and valuable information from extensive and diverse sets of unstructured data collection from different sources and varying in sizes.

Here’s what you need to understand about data – everything on the internet can be its source. For example:

  • content preferences
  • different types of interactions with certain kinds of content or ads
  • use of certain features in the applications
  • search requests
  • browsing activity
  • online purchases

This data is analyzed and integrated into a bigger context to amplify business operation and make it as effective as possible.

Raw data is like a diamond in the rough. Data Mining takes the rough part, and then Data Analytics provides the polish. That’s the general description of what Big Data Analytics is doing. In fact, data mining gets “unrefined” information “from the bowels”, and then it needs to be finalized depending on the tasks. From that moment on, the process of analyzing raw data goes on.

Data Analysis vs Data Analytics vs Data Science

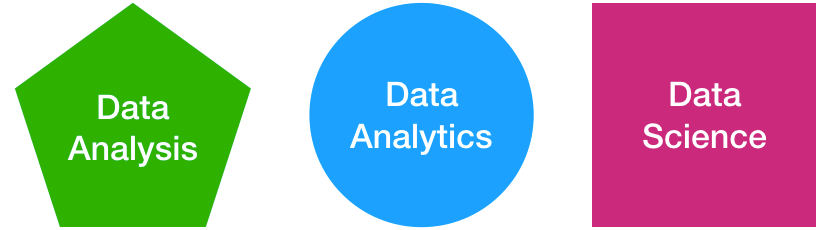
Data Analysis vs. Data Analytics vs. Data Science

Many terms sound the same, but they are different in reality. In case you are confused about what is the difference between data science, analytics, and data analysis, it’s easy to distinguish: 

  • The data analysis primarily focuses on processes and functions

  • The data analytics deal with information, dashboards, and reporting

  • The data science includes data analysis but also has elements of data cleaning and preparation for further investigation (from data mining)

Role of Data Analyst in the Business

Data Analysts are the specialists who control the data flows and make sense of the data using specific software.

Basic data analytics operations don’t require specialized personnel to handle the process (usually it can take care of by stand-alone software), but in the case of Big Data analytics, you do need qualified Data Business Analysts.

The purpose of a Data Analyst is to

  1. Study the information
  2. Clean it from noise
  3. Assess the quality of data and its sources
  4. Develop the scenarios for automation and machine learning
  5. Oversee the proceedings

Use of Big Data in Data Analytics

You don’t need Big Data for Data Analytics since the latter is about analyzing whatever information you have. However, why is big data important? Because it can be a deeper and more fulfilling source of insights, which is especially useful in the case of prediction and prescription analytics.

Data Analytics is all about making sense of information for your business operation and making use of it in the context of your chosen course of action.

It is essential to understand what kind of statistical analysis needs to be applied to make the most of available information and turn a pile of historical data into a legitimate strategic advantage.

There are four big categories of Data Analytics operation. Let’s look at them one by one.

Different Types of Data Analytics

Descriptive Analytics - What Happened?

Descriptive Analytics – What Happened?

The purpose of descriptive analytics is to show the layers of available information and present it in a digestible and coherent form. It is the most basic type of data analytics, and it forms the backbone for the other models.

Descriptive analytics is used to understand the big picture of the company’s process from multiple standpoints. In short – it is

  1. What is going on?
  2. How is it going on?
  3. Is it any good for business within a selected period?

Because descriptive analytics are so basic, this type is used throughout industries from marketing and ecommerce to banking and healthcare (and all the other.) One of the most prominent descriptive analytics tools is Google Analytics.

From the technical standpoint, the descriptive operation can be explained as an elaborate “summarizing.” The algorithms process the datasets and arrange them according to the found patterns and defined settings and then present it in a comprehensive form.

For example, you have the results of the marketing campaign for a certain period. In this case, descriptive analytics shows the following stats of interacting with content:

  • Who (user ID);
  • Circumstances (source – direct, referral, organic);
  • When (date);
  • How long (session time).

The insights help to adjust the campaign and focus it on more relevant and active segments of the target audience.

Descriptive analytics is also used for the optimization of real-time bidding operation in Ad Tech. In this case, the analytics show the effectiveness of spent budgets and shows the correlation between spending and the campaign’s performance. Depending on the model, the efficiency is calculated using goal actions like conversions, clicks, or views. 

Diagnostic Analytics - How It Happened?

Diagnostic Analytics – How It Happened?

The purpose of diagnostic analytics is to understand:

  • why certain things happened
  • what caused these turns of events.

Diagnostic analytics is an investigation aimed at studying the effects and developing the right kind of reaction to the situation.

The operation includes the following steps:

  • Anomaly Detection. The anomaly is anything that raises the question of its appearance in the analytics, whatever doesn’t fit the norm. It can be a spike of activity when it wasn’t expected or a sudden drop in the subscription rate of your social media page.
  • Anomaly Investigation. To do something, you need to understand how it happened. This process includes the identification of sources and finding patterns in the data sources.
  • Causal Relationship Determination. After the events that caused anomalies are identified – it is time to connect the dots. This may involve the following practices:
    • Probability analysis
    • Regression analysis
    • Filtering
    • Time-series data analytics

Diagnostic Analytics is often used in Human Resources management to determine the qualities and potential of employees or candidates for positions.

It can also apply comparative analysis to determine the best fitting candidate by selected characteristics or to show the trends and patterns in a specific talent pool over multiple categories (such as competence, certification, tenure, etc.)

Predictive Analytics - What Could Happen?

Predictive Analytics – What Could Happen?

As you might’ve guessed from the title – predictive analytics is designed to foresee:

  • what the future holds (to a certain degree)
  • show a variety of possible outcomes

In business, it’s often much better to be proactive rather than reactive. Therefore, Predictive Analytics helps you to understand how to make successful business decisions that bring value to companies. 

How do the Predictive Analytics algorithms work?

  • Go through the available data from all relevant sources (for example, it can be one source or a combination of ERP, CRM, HR systems);
  • Combine it into one big thing;
  • Identify patterns, trends, and anomalies;
  • Calculate possible outcomes.

While predictive analytics estimates the possibilities of certain outcomes, it doesn’t mean these predictions are a sure thing. However, armed with these insights, you can make wiser decisions.

Have a Project In Mind?

Estimate Its Costs

Application areas of Predictive Analytics:

  • Marketing – to determine trends and potential of particular courses of action. For example, to define the content strategy and types of content more likely to hit the right chord with the audiences;   
  • Ecommerce / Retail – to identify trends in customer’s purchase activities and operate product inventory accordingly.  
  • Stock exchanges – to predict the trends of the market and the possibilities of changes in various scenarios.
  • Healthcare – to understand possible outcomes of disease outbreak and its treatment methodology. It is used for scenario simulation studies and training.
  • Sports – for predicting game results and keeping track of betting;
  • Construction – to assess structures and material use;
  • Accounting – for calculating probabilities of certain scenarios, assessing current tendencies, and providing several options for decision making.
Prescriptive Analytics - What Should We Do?

Prescriptive Analytics – What Should We Do?

Not to confuse prescriptive and predictive analytics:

  • Predictive analytics says what might happen in the future
  • Prescriptive analytics is all about what to do in the future

This digging into customer data presents a set of possibilities and opportunities as well as options to consider in various scenarios.

Tech-wise, prescriptive analytics consists of a combination of:

All this is used to calculate as many options as possible and assess their probabilities.

Then you can turn to predictive analytics and look for further outcomes (if necessary). It is commonly used for the following activities:

  • Optimization procedures;
  • Campaign management;
  • Budget management;
  • Content scheduling;
  • Content optimization;
  • Product inventory management.

Prescriptive analytics is used in a variety of industries. Usually, it is used to provide an additional perspective into the data and give more options to consider upon taking action, for example:

  • Marketing – for campaign planning and adjustment;
  • Healthcare – for treatment planning and management;
  • E-commerce / Retail – in inventory management and customer relations;
  • Stock Exchanges – in developing operating procedures;
  • Construction – to simulate scenarios and better resource management.
Use Cases for Data Analytics

Big Data Analytics Use Cases

Now let’s look at the fields where data analytics makes a critical contribution.

Sales and Operations Planning Tools

Sales and operations planning tools are something like a unified dashboard from which you can perform all actions. In other words, it is a tight-knit system that uses data analytics on a full scale.

As such, S&OP tools are using a combination of all four types of data analytics and related tools to show and interact with the available information from multiple perspectives.

These tools are aimed specifically at developing overarching plans with every single element of operation past, present, or future is taken into consideration to create a strategy as precise and flexible as possible.

The most prominent examples are the Manhattan S&OP and Kinxaxis Rapid Response S&OP. However, it should be noted that there are also custom solutions tailor-made for the specific business operation.

Download Free E-book with DevOps Checklist

Download Now

Recommendation Engines

Internal and external recommender engines and content aggregators are some of the purest representations of data analytics on a consumer level.

The mechanics behind it is simple:

  1. The user has some preferences and requirements, noted by the system.
  2. Web crawling or internal search tools for relevant matches based on user preferences. 
  3. If there is a match, it’s included in the options.

There are two types of user preferences that affect the selection:

  • Direct feedback via ratings;
  • Indirect via interacting with the specific content from the various sites.

As a result of this, the user gets the content s/he will most likely interact with offered.

One of the most prominent examples of this approach is used by Amazon and Netflix search engines. Both of them are using extensive user history and behavior (preferences, search queries, watch time) to calculate the relevancy of the suggestions of the particular products.

Also, Google Search Engine personalization features enable more relevant results based on expressed user preferences.

Customer Modelling / Audience Segmentation

The customer is always on the front stage. One of the most common usages of data analytics is aimed at:

  • Defining and describing customers;
  • Recognizing distinct audience segments;
  • Calculating their possible courses of actions in certain scenarios.

Since the clearly defined target audience is the key for a successful business operation – user modelling is widely used in a variety of industries, most prominently in digital advertising and e-commerce.

How does it work? Every piece of information that the user produces keeps some insight that helps to understand what kind of product or content he might be interested in.

This information helps to construct a big picture of:

  • Who is your target audience;
  • Which segments are the most active;
  • What kind of content or product can be targeted towards which of the audience segments;

Amazon is good at defining audience segments and relevant products to the particular customer (which helps it to earn a lot of money, too.)

We have our case study regarding user modeling and segmentation with the Eco project. In that case, we did a cross-platform analytics solution that studied the patterns of product use in order to determine audience segments and improve user experience across the board.

Market Research / Content Research

Knowledge is half of the battle won and nothing can do it better than a well-tuned data analytics system.

Just as you can use data analytics algorithms to determine and thoroughly describe your customer, you can also use similar tools to describe the environment around you and get to know better what the current market situation is and what kind of action should be taken to make the most out of it.  

Fraud Prevention

Powers of hindsight and foresight can help to expose fraudulent activities and provide a comprehensive picture.

The majority of fraudulent online activities are made with the assistance of automated mechanisms. The thing with automated mechanisms is that they work in patterns and patterns are something that can be extracted out of the data.

This information can be integrated into a fraud detecting system. Such approaches are used to filter out spam and detect unlawful activities with doubtful accounts or treacherous intentions.

Price Optimization

One of the critical factors in maintaining competitiveness on the market in e-commerce and retail is having more attractive prices than the competition.

In this case, the role of data analytics is simple – to watch the competition and adjust the prices of the product inventory accordingly.

The system is organized around a couple of mechanisms:

  1. Crawler tool that checks the prices on the competitor’s marketplaces;
  2. Price comparison tool which includes additional fees such as shipping and taxes;
  3. Price adjustment tool that automatically changes the cost of a particular product.

To manage discounts or special offer campaigns, one can also use these tools.

Big Data Analytics Software

Big Data Tools: Data Analytics Software

In addition to custom solutions, there are several useful ready-made data analytics tools that you can fit into your business operation.

Basic

  • Excel Spreadsheet – the most basic tool for data analytics. It can be done manually and show enough information to understand what is going on in general terms.
  • Google Analytics is a standard descriptive analytics tool that provides information about website traffic, source and basic stats on user behavior. Can be used for further visualization via Data Studio.
  • Zoho Reports is a part-descriptive-analytics part-task-management tool. Useful for project reporting and tracking progress. Works well to assess campaign performance results.

Sophisticated

  • Tableau Desktop – with this tool you can make any scope of data comprehensible in the form of graphs and tables. Good for putting things into perspective. Easy to use, light on the pocket.
  • The demo analytics tool is good for medium-sized operations to gather and analyze data from their own large networks. In addition to visualization, it is capable of assessing probabilities of different scenarios and proposing better fitting courses of action.
  • Style Scope is useful for teamwork and planning. It maps data from a different source on one map and in the process unlocks its hidden possibilities.

Heavy Artillery

  • Microsoft Power BI can consolidate incoming data from multiple sources, extract insights, assess probabilities of various turns of events, and put them into a broader context with a detailed breakdown of possible options. In other words, it turns Jackson Pollock’s painting into Piet Mondrian’s grid.
  • Looker is a multi-headed beast of a tool. With its help, you can combine data from multiple sources – track overall progress, break it down to the element, extract insights, and calculate possibilities – all in one convenient dashboard.
  • SAP ERP is primarily used for sales management and resource planning. With its help, you can map out the goals, combine information, assess performance and possibilities, and decide what to do next.

In Conclusion

Here we figured out – what is data analytics? These days, data analytics is one of the key technologies in the business operation. Data mining provides the information, and Data Analytics helps to gain useful insights from that information to integrate them into the business process and enjoy the benefits.

So take advantage of data analytics as a compass to navigate in the sea of information.

Read also: Big Data in Customer Analytics

Looking for a data analytics solution? Let's create a custom one.

Write to us 

Case Study: Real-time Diagnostics from Nanopore DNA Sequencers

Data Analysis in Healthcare is a matter of life and death, and it’s also a very time-consuming task when you do not have the proper tools. When we are talking about sepsis – the dangerous condition when the body starts to attack its organs and tissues in attempts to fight off the bacteria or other causes – the risk of losing the patient due to sepsis increases by 4% with each hour.

The researchers from the University of Queensland and the Google Cloud Platform developers have teamed up with the APP Solutions developers to provide medical doctors with a tool to help patients before they suffer from septic shock.

With the emergence of nanopore DNA sequencers, this task becomes manageable and much more efficient. These sequencers stream raw data and generate results within 24 hours, which is a significant advantage, especially when doctors need to identify pathogenic species and antibiotic resistance profile.

The primary challenge, from the technical point of view, lies with data processing, which requires significant resources for processing and subsequent storage of incoming data. The APP Solutions team tackled the development of a cloud-based solution to solve this challenge.

About the Project: Nanopore DNA Sequencers

Our team worked on the cloud-based solution for the Nanopore DNA Sequencing, and we have developed a Cloud Dataflow integrated with the following technologies:

  • FastQ Record Aligner
  • JAPSA Summarizer
  • Cloud Datastore and App Engine
  • App Dashboard

The pipeline itself consists of the following elements:

  • Chiron base caller implemented as a deep neural-network
  • Detectors for species and antibiotic resistance genes
  • Databases for long-term experimental data storage and post-hoc analysis
  • A browser-based dynamic dashboard to visualize analysis results as they are generated

Overall, the system is designed to perform the following actions:

  • Resistance Gene Detection: this pipeline identifies antibiotic resistance genes present in a sample and points out actionable insights, e.g., what treatment regimen to apply to a particular patient.
  • Species Proportion Estimation: this pipeline estimates the proportion of pathogenic species present in a sample. Proportion estimation can be useful in a variety of applications including clinical diagnostics, biosecurity, and logistics/supply-chain auditing.

The software is open-source, built on the open-source packages:

  • JAPSA
  • TensorFlow
  • Apache Beam
  • D3

We have used Google Cloud to implement the data analysis application due to its scaling capacity, reliability, and cost-effectiveness. It includes a wide array of scalable features for Tensor Processing Units and AI accelerator microchips.

The transformation of information follows this sequence:

  1. Integration – files are uploaded to the Google Cloud Platform and streamed into the processing pipeline;
  2. Base-calling stage – machine learning model infers DNA sequences from electrical signals;
  3. Alignment stage – via a DNA database, the samples are analyzed to find pathogen sequences and other anomalies;
  4. Summarization stage – calculation of each pathogen’s percentage in the particular sample;
  5. Storage and visualization – the results are saved to Google Firestore DB and subsequently visualized in real-time with D3.js.

Watch the video about the project: 

Nanostream Project Tasks & Challenges

Ensuring Data Scalability

Nanopore Sequencer DNA Analysis is a resource-demanding procedure that requires speed and efficiency to be genuinely useful in serving its cause.

Due to the high volume of data and tight time constraints, the system needs to scale accordingly, which was achieved via the Google Cloud Platform and its autoscaling features. GCP secures smooth and reliable scalability for data processing operations.

To keep the data processing workflow uninterrupted no matter the workload, we used Apache Beam.

Refining Data Processing and Analysis Algorithms

Accuracy is the central requirement for the data processing operation in genomics, especially in the context of DNA Analysis and pathogen detection.

The project required a fine-tuned, tight-knit data processing operation with an emphasis on providing a broad scope of results in minimal time.

Our task was to connect the analytics application to the cloud platform and guarantee an effective information turnaround. The system was thoroughly tested to ensure the accuracy of results and efficiency of the processing.

Integrating with DNA Analysis Tools

DNA Analysis tools for Nanopore sequencers were not initially developed for cloud platforms and distributed services. The majority of the analysis tools were just desktop utilities, but this significantly limited capability. We needed to integrate the desktop-based DNA analysis tools into a unified, scalable system.

We have reinterpreted desktop-based DNA analysis tools for HTTP format and distributed them as web services, which made them capable of processing large quantities of data in a shorter timespan.

Securing Cost-Effectiveness & Reducing Overhead

Nanopore DNA Sequencers are a viable solution for swift pathogen analysis and more competent medical treatment. However, the maintenance of such devices can be a challenging task for medical facilities due to resource and personnel requirements. Also, the scope of its use is relatively limited in comparison with the required expenditures.

We moved the entire system to Google Cloud Platform to solve this issue, allowing the service to be accessed and scaled without unnecessary overhead expenses.

Developing Accessible User Interface

Machine learning and big data analysis systems can process much data, but it’s useless until the insights are presented in such a way that is understandable. In the case of the Nanopore DNA Sequencing solution, the idea was to give a tool to the medical staff that would help them make decisions in critical situations and save lives. Therefore, an accessible presentation was one of the essential elements of this research project.

The system needed an easy-to-follow and straightforward interface that provided all the required data in a digestible form, avoiding confusion.

To create the most convenient user interface design scheme, we have applied extensive user testing. The resulting user interface is an interactive dashboard with multiple types of visualization and reporting at hand that requires minimal effort to get accustomed to and start using it.

When it came to visualization, the initial format of choice was a pie chart. However, it was proven insufficient in more complex scenarios.

Because of that, we have concluded that there was a need to expand the visualization library and add a couple of new options, which was where the D3 data visualization library helped us out.

Throughout extensive testing, we have figured out that Sunburst diagrams are doing an excellent job of showing the elements of the sample in an accessible form.

Project’s Tech Stack & Team

There were many technologies involved, the majority of which had to do with big data analysis and cloud: 

  • JAPSA
  • TensorFlow
  • Chiron Base Caller
  • Google Cloud
  • Google Cloud Storage
  • Google Cloud PubSub
  • Google FireStore
  • Google Cloud Dataflow
  • Apache Beam
  • D3 Data Visualization Library
  • JavaScript

Related articles:

How to Pick Best Tech Stack for Your Project

Calmerry Telemedicine Platform Case Study 

From the APP Solutions’ side, we had four people working on this Nanopore DNA Sequencers project: 

  • 2 Data Engineers
  • 1 DevOps Engineer
  • 1 Web Developer

Creating Nanopore DNA Sequencing Cloud-Based Solutions

This project was an incredible experience for our team. We had a chance to dive deep into the healthcare industry as well as machine learning, data analysis, and Google Cloud platform capabilities.

While we were exploring the possibilities of data analysis in healthcare applications – we found out many parallels between data analysis in other fields.

We have managed to apply our knowledge of cloud infrastructure and build a system that is capable of processing large quantities of data in a relatively short time – and help doctors save patients’ lives!

Learn more about the project and check out our contributions to GitHub:

What our clients say 

Looking for a big data analytics partner?

Contact us

Natural Language Processing Tools and Libraries

Natural language processing helps us to understand the text receive valuable insights. NLP tools give us a better understanding of how the language may work in specific situations. Moreover, people also use it for different business purposes. Such proposes might include data analytics, user interface optimization, and value proposition. But, it was not always this way.

The absence of natural language processing tools impeded the development of technologies. In the late 90s, things had changed. Various custom text analytics and generative NLP software began to show their potential.

Now the market is flooded with different natural language processing tools.

Still, with such variety, it is difficult to choose the open-source NLP tool for your future project.

In this article, we will look at the most popular NLP processing tools, their features, and use cases.

Let’s start

Build Your Own Dedicated Team

8 Best NLP tools and libraries

natural language processing tools examples NLTK NLP Tool

1. NLTK – entry-level open-source NLP Tool

Natural Language Toolkit (AKA NLTK) is an open-source software powered with Python NLP. From this point, the NLTK library is a standard NLP tool developed for research and education.

NLTK provides users with a basic set of tools for text-related operations. It is a good starting point for beginners in Natural Language Processing.

Natural Language Toolkit features include:

  • Text classification
  • Part-of-speech tagging
  • Entity extraction
  • Tokenization
  • Parsing
  • Stemming
  • Semantic reasoning

NLTK interface includes text corpora and lexical resources.

They include:

  • Penn Treebank Corpus
  • Open Multilingual Wordnet
  • Problem Report Corpus
  • and Lin’s Dependency Thesaurus

Such technology allows extracting many insights, including customer activities, opinions, and feedback.

Natural Language Toolkit is useful for simple text analysis. But, if you need to work on a massive amount of data, try something else. Why? Because in this case, Natural Language Toolkit requires significant resources.

Do you want to know more about the NLTK application?

Check Out MSP Case Study: How Semantic Search Can Improve Customer Support

Stanford Core NLP Library

2. Stanford Core NLP – Data Analysis, Sentiment Analysis, Conversational UI

We can say that the Stanford NLP library is a multi-purpose tool for text analysis. Like NLTK, Stanford CoreNLP provides many different natural language processing software. But if you need more, you can use custom modules.

The main advantage of Stanford NLP tools is scalability. Unlike NLTK, Stanford Core NLP is a perfect choice for processing large amounts of data and performing complex operations.

With its high scalability, Stanford CoreNLP is an excellent choice for:

  • information scraping from open sources (social media, user-generated reviews)
  • sentiment analysis (social media, customer support)
  • conversational interfaces(chatbots)
  • text processing, and generation(customer support, e-commerce)

This tool can extract all sorts of information. It has smooth named-entity recognition and easy mark up of terms and phrases.

Get Your Specific NLP Task Completed within 24 Hours

Get to Know

Apache OpenNLP - Data Analysis and Sentiment Analysis

3. Apache OpenNLP – Data Analysis and Sentiment Analysis

Accessibility is essential when you need a tool for long-term use, which is challenging in the realm of Natural Language Processing open-source tools. Because while being powered with the right features, it could be too complex to use.

Apache OpenNLP is an open-source library for those who prefer practicality and accessibility. Like Stanford CoreNLP, it uses Java NLP libraries with Python decorators.

While NLTK and Stanford CoreNLP are state-of-the-art libraries with tons of additions, OpenNLP is a simple yet useful tool. Besides, you can configure OpenNLP in the way you need and get rid of unnecessary features.

Apache OpenLP is the right choice for:

  • Named Entity Recognition
  • Sentence Detection
  • POS tagging
  • Tokenization

You can use OpenNLP for all sorts of text data analysis and sentiment analysis operations. It is also perfect in preparing text corpora for generators and conversational interfaces.

SpaCy - NLP Library

4. SpaCy – Data Extraction, Data Analysis, Sentiment Analysis, Text Summarization

SpaCy is the next step of the NLTK evolution. NLTK is clumsy and slow when it comes to more complex business applications. At the same time, SpaCy provides users with a smoother, faster, and efficient experience.

SpaCy, an open-source NLP library, is a perfect match for comparing customer profiles, product profiles, or text documents.

SpaCy is good at syntactic analysis, which is handy for aspect-based sentiment analysis and conversational user interface optimization. SpaCy is also an excellent choice for named-entity recognition. You can use SpaCy for business insights and market research.

Another SpaCy advantage is word vector usage. Unlike OpenNLP and CoreNLP, SpaCy works with word2vec and doc2vec.

Discover More About Word2vec in our Award-Winning Case Study: AI Versus – TV RAIN

Still, the main advantage of SpaCy over the other NLP tools is its API. Unlike Stanford CoreNLP and Apache OpenNLP, SpaCy got all functions combined at once, so you don’t need to select modules on your own. You create your frameworks from ready building blocks.

SpaCy is also useful in deep text analytics and sentiment analysis.

AllenNLP - Text Analysis, Sentiment Analysis

5. AllenNLP – Text Analysis, Sentiment Analysis

Built on PyTorch tools & libraries, AllenNLP is perfect for data research and business applications. It evolves into a full-fledged tool for all sorts of text analysis. This way, it is one of the more advanced Natural Language Processing tools on this list.

AllenNLP uses SpaCy open-source library for data preprocessing while handling the rest processes on its own. The main feature of AllenNLP is that it is simple to use. Unlike other NLP tools that have many modules, AllenNLP makes the natural language process simple. So you never feel lost in the output results. It is an excellent tool for inexperienced users.

The machine comprehension model provides you with resources to make an advanced conversational interface. You can use it for customer support as well as lead generation via website chat.

So, the textual entailment model guarantees smooth and comprehensible text generation. You can use it for both multi-source text summarization and simple user-bot interaction.

The most exciting model of AllenNLP is Event2Mind. With this tool, you can explore user intent and reaction, which are essential for product or service promotion.

Omit, AllenNLP is suitable for both simple and complex tasks. AllenNLP performs specific duties with predicted results and enough space for experiments.

GenSim NLP Library

6. GenSim – Document Analysis, Semantic Search, Data Exploration

Sometimes you need to extract particular information to discover business insights. GenSim is the perfect tool for such things. It is an open-source NLP library designed for document exploration and topic modeling. It would help you to navigate the various databases and documents.

The key GenSim feature is word vectors. It sees the content of the documents as sequences of vectors and clusters. And then, GenSim classifies them.

GenSim is also resource-saving when it comes to dealing with a large amount of data.

The main GenSim use cases are:

  • Data analysis
  • Semantic search applications
  • Text generation applications (chatbot, service customization, text summarization, etc.)
TextBlob Library - Conversational UI, Sentiment Analysis

7. TextBlob Library – Conversational UI, Sentiment Analysis

TextBlob is the fastest natural language processing tool. TextBlob is an open-source NLP tool powered by NLTK. It could be enhanced with extra features for more in-depth text analysis.

You can use TextBlob sentiment analysis for customer engagement via conversational interfaces. Besides, you can build a model with the verbal skills of a broker from Wall Street.

Another TextBlob notable feature is machine translation. Content localization has become trendy and useful. For that, it would be great to have your website/application localized in an automated manner. Using TextBlob, you can optimize the automatic translation using its language text corpora.

TextBlob also provides tools for sentiment analysis, event extraction, and intent analysis features. TextBlob has different flexible models for sentiment analysis. Thus, you can build entire timelines of sentiments and look at things in progress.


Intel NLP Architect - Data Exploration, Conversational UI3

8. Intel NLP Architect – Data Exploration, Conversational UI3

Intel NLP Architect is the newer application in this list. Intel NLP Architect uses Python library for deep learning using recurrent neural networks. You can use it for:

  • text generation and summarization
  • aspect-based sentiment analysis
  • and conversational interfaces such as chatbots

One of its most exciting features is Machine Reading Comprehension. NLP Architect applies a multi-layered approach by using many permutations and generated text transfigurations. In other words, it makes the output capable of adapting the style and presentation to the appropriate text state based on the input data. You can use it for more personalized services.

The other great feature of Architect NLP is Term Set Expansion. This set of NLP tools fills in the gap of data based on its semantic features. Let’s look at an example.

When making research on virtual assistants, your initial input would be “Siri” or “Cortana.” Term Set Expansion (TSE) adds the other relevant options as “Amazon Echo.” In more complex cases, TSE is capable of scraping bits and pieces of information based on longer queries.

NLP Architect is the most advanced tool being one step further, getting deeper into the sets of text data for more business insights.

You might also like Guide to machine learning applications: 7 major fields.

How to make your IT project secured?

Download Secure Coding Guide

Choosing a Particular NLP Library

Natural Language Processing tools are all about analyzing text data and receiving useful business insights out of it.

But it is hard to find the best NLP library for your future project. This way, to make the right decision, you should be aware of the alternatives. Also, you should choose your next NLP tool according to its use case. There is no reason to take a state-of-the-art library when you need to wrangle the text corpus and clean it from all data noise.

If you want to receive a consultation on Natural Language Processing, fill in the contact form, and we will get in touch.


Want to receive reading suggestions once a month?

Subscribe to our newsletters