Data Mining: The Definitive Guide to Techniques, Examples, and Challenges

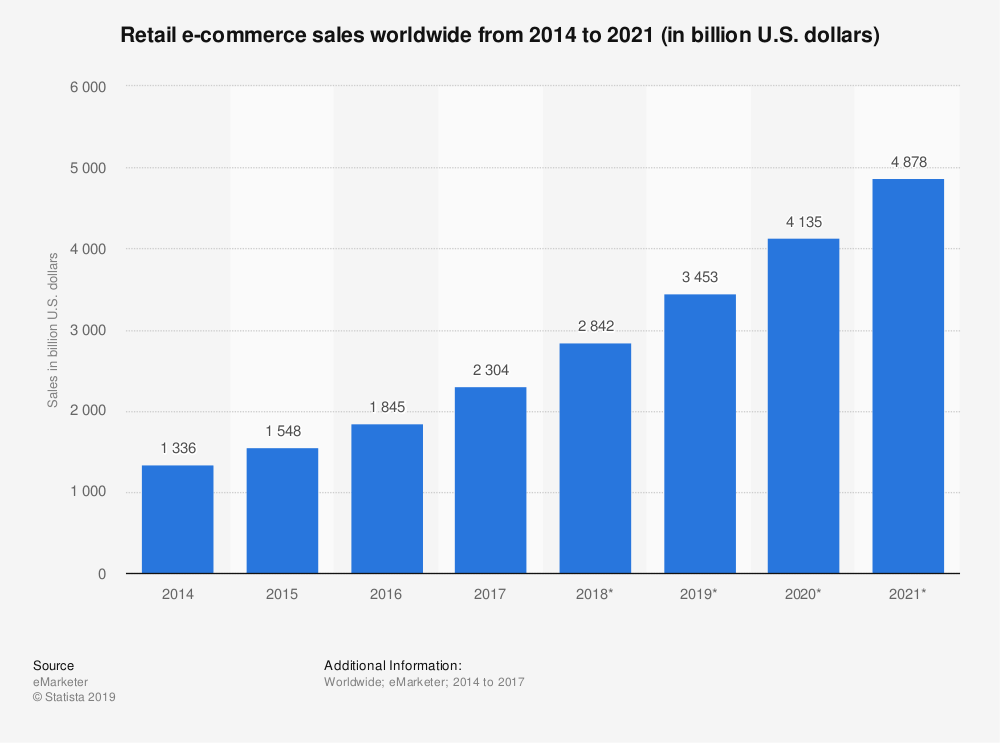
We live in the age of massive data production. If you think about it – pretty much every gadget or service we are using creates a lot of information (for example, Facebook processes around 500+ terabytes of data each day). All this data goes straight back to the product owners, which they can use to make a better product. This process of gathering data and making sense of it is called Data Mining.

However, this process is not as simple as it seems. It is essential to understand the hows, whats, and whys of data mining to use it to its maximum effect.

What is Data Mining?

Data mining is the process of sorting out the data to find something worthwhile. If being exact, mining is what kick-starts the principle “work smarter not harder.”

At a smaller scale, mining is any activity that involves gathering data in one place in some structure. For example, putting together an Excel Spreadsheet or summarizing the main points of some text.

Data mining is all about:

  • processing data;
  • extracting valuable and relevant insights out of it.

Purpose of Data Mining

There are many purposes data mining can be used for. The data can be used for:

  • detecting trends;
  • predicting various outcomes;
  • modeling target audience;
  • gathering information about the product/service use;

Data mining helps to understand certain aspects of customer behavior. This knowledge allows companies to adapt accordingly and offer the best possible services.

 Big Data vs. Data Mining

Difference between Data Mining and Big Data

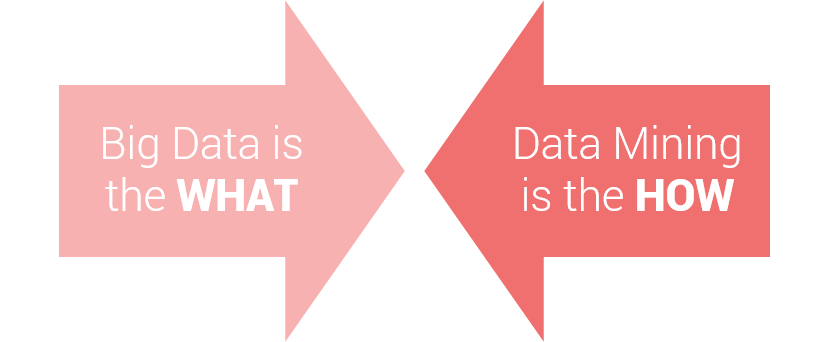
Let’s put this thing straight:

  • Big Data is the big picture, the “what?” of it all.
  • Data Mining is a close-up on the incoming information – can be summarized as “how?” or “why?”

Now let’s look at the ins and outs of Data Mining operations.

How Does Data Mining Work?

Stage-wise, data mining operation consists of the following elements:

  • Building target datasets by selecting what kind of data you need;
  • Preprocessing is the groundwork for the subsequent operations. This process is also known as data exploration.
  • Preparing the data – a creation of the segmenting rules, cleaning data from noise, handling missing values, performing anomaly checks, and other operations. This stage may also include further data exploration.
  • Actual data mining starts when a combination of machine learning algorithms gets to work.

Data Mining Machine Learning Algorithms

Overall, there are the following types of machine learning algorithms at play:

  • Supervised machine learning algorithms are used for sorting out structured data:
    • Classification is used to generalize known patterns. This is then applied to the new information (for example, to classify email letter as spam);
    • Regression is used to predict certain values (usually prices, temperatures, or rates);
    • Normalization is used to flatten the independent variables of data sets and restructure data into a more cohesive form.
  • Unsupervised machine learning algorithms are used for the exploration of unlabeled data:
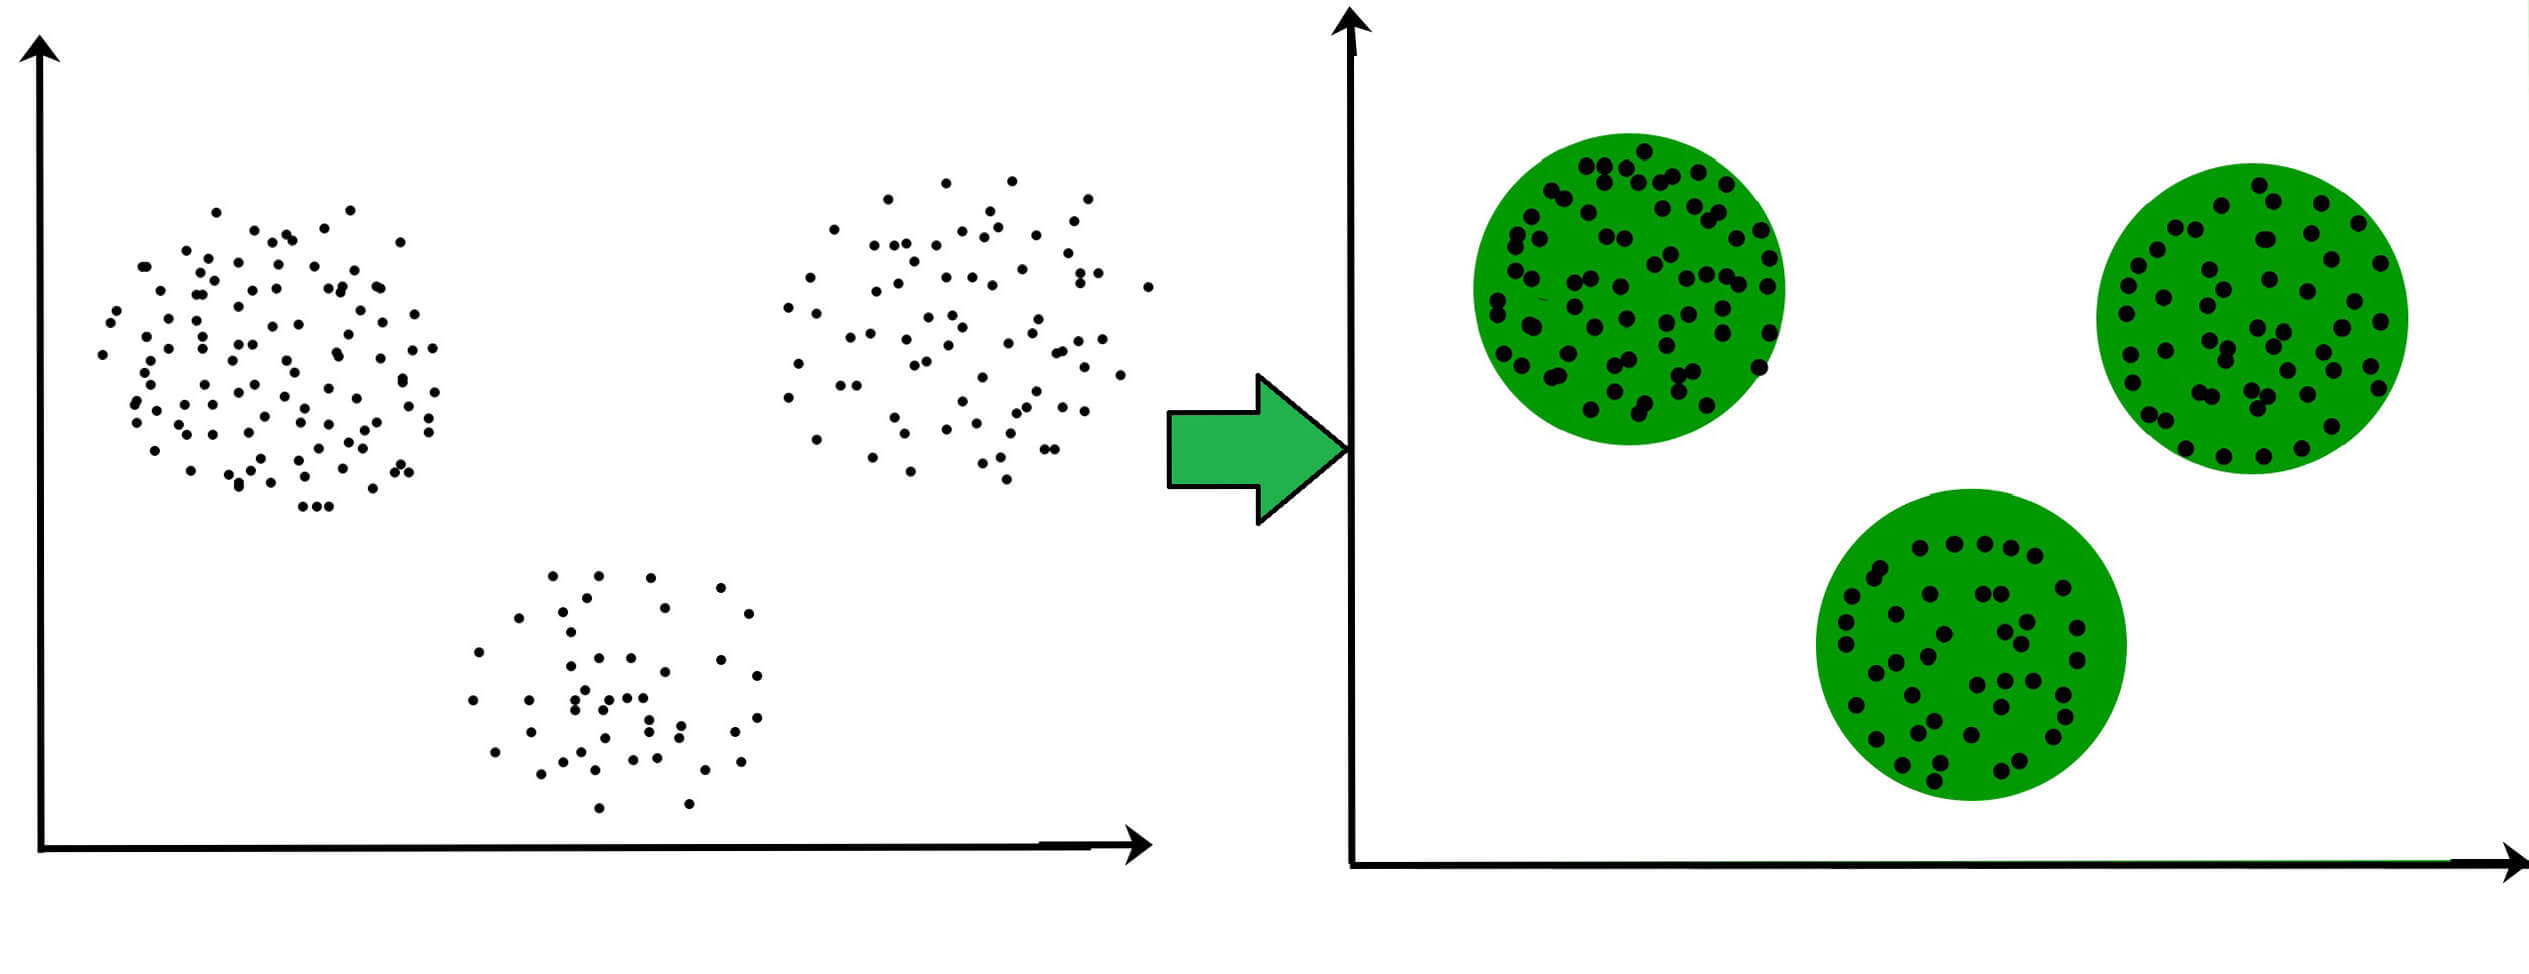
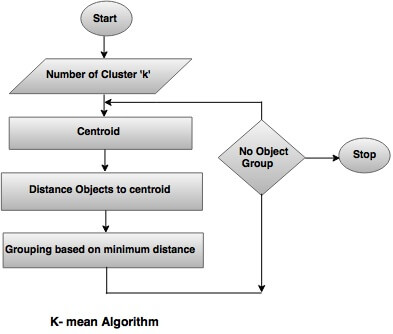
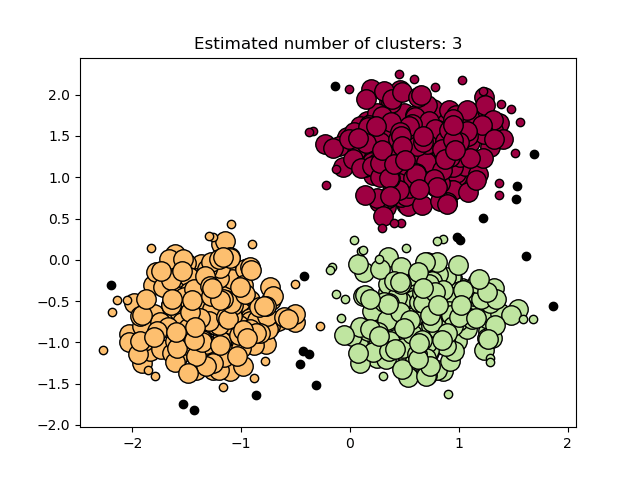
    • Clustering is used to detect distinct patterns (AKA groups AKA structures
    • Association rule learning is used to identify the relationship between the variables of the data set. For example, what kind of actions are performed most frequently;
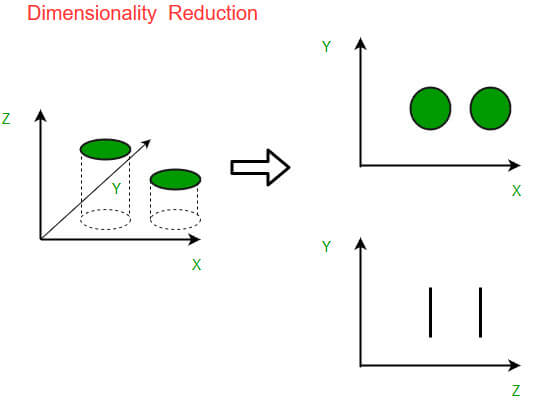
    • Summarization is used for visualization and reporting purposes;
  • Semi-supervised ML algorithms are a combination of the aforementioned methodologies;
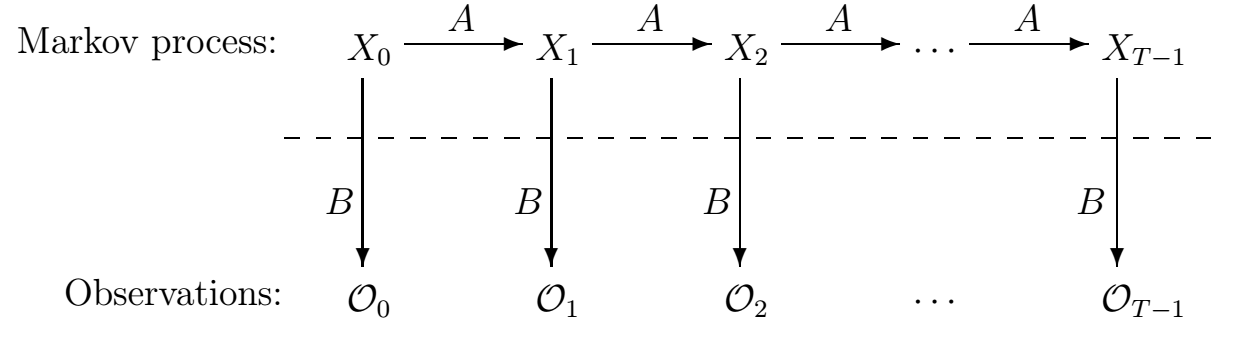
  • Neural Networks – these are complex systems used for more intricate operations.

Now let’s take a look at the industries where mining is applied.

Examples of Data Mining

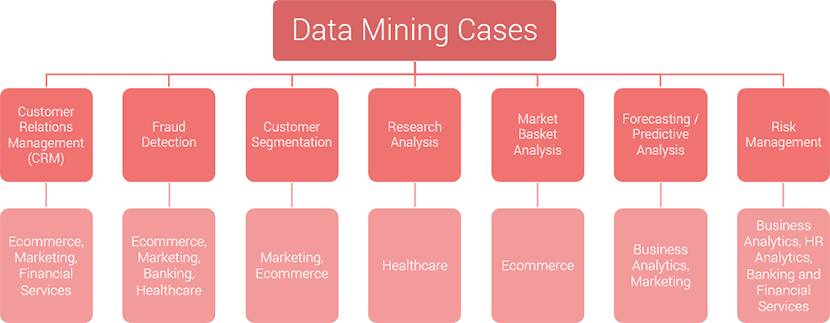
Examples of Data Mining in business

Marketing, eCommerce, Financial Services – Customer Relationship Management

All industries can benefit from CRM systems that are widely used in a variety of industries – from marketing to eCommerce to healthcare and leisure.

The role of data mining in CRM is simple:

  • To get insights that will provide a solid ground for attaining and retaining customers
  • To adapt services according to the ebbs and flows of the user behavior patterns.

Usually, data mining algorithms are used for two purposes:

  • To extract patterns out of data;
  • To prepare predictions regarding certain processes;

Customer Relationship Management relies on processing large quantities of data in order to deliver the best service based on solid facts. Such CRMs as Salesforce and Hubspot are built around it.

The features include:

  • Basket Analysis (tendencies and habits of users);
  • Predictive Analytics
  • Sales forecasting;
  • Audience segmentation;
  • Fraud detection;

eCommerce, Marketing, Banking, Healthcare – Fraud Detection

As it was explained in our Ad Fraud piece, fraud is one of the biggest problems of the Internet. Ad Tech suffers from it, eCommerce is heavily affected, banking is terrorized by it.

However, the implementation of data mining can help to deal with fraudulent activity more efficiently. Some patterns can be spotted and subsequently blocked before causing mayhem, and the application of machine learning algorithms helps this process of detection.

Overall, there are two options:

  • Supervised learning – when the dataset is labeled either “fraud” or “non-fraud” and algorithm trains to identify one and another. In order to make this approach effective, you need a library of fraud patterns specific to your type of system.
  • Unsupervised learning is used to assess actions (ad clicks, payments), which are then compared with the typical scenarios and identified as either fraudulent or not.

Here’s how it works in different industries:

  • In Ad Tech, data mining-based fraud detection is centered around unusual and suspicious behavior patterns. This approach is effective against click and traffic fraud.
  • In Finance, data mining can help expose reporting manipulations via association rules. Also – predictive models can help handle credit card fraud.
  • In Healthcare, data mining can tackle manipulations related to medical insurance fraud.

Marketing, eCommerce – Customer Segmentation

Knowing your target audience is at the center of any business operation. Data mining brings customer segmentation to a completely new level of accuracy and efficiency. Ever wondered how Amazon knows what are you looking for? This is how.

Customer segmentation is equally important for ad tech operation and for eCommerce marketers. Customer’s use of a product or interaction with ad content provides a lot of data. These bits and pieces of data show customers:

  • Interests
  • Tendencies and preferences
  • Needs
  • Habits
  • General behavior patterns

This allows constructing more precise audience segments based on practical aspects instead of relying on demographic elements. Better segmentation leads to better targeting, and this leads to more conversions which is always a good thing.

You can learn more about it in our article about User Modelling.

Healthcare – Research Analysis

The research analysis is probably the most direct use of data mining operations. Overall, this term covers a wide variety of different processes that are related to the exploration of data and identifying its features.

The research analysis is used to develop solutions and construct narratives out of available data. For example, to build a timeline and progression of a disease outbreak.

The role of data mining in this process is simple:

  1. Cleaning the volumes of data;
  2. Processing the datasets;
  3. Adding the results to the big picture.

The critical technique, in this case, is pattern recognition.

The other use of data mining in research analysis is for visualization purposes. In this case, the tools are used to reiterate the available data into more digesting and presentable forms.

eCommerce – Market Basket Analysis

Modern eCommerce marketing is built around studying the behavior of the users. It is used to improve customer experience and make the most out of every customer. In other words, it uses user experience to perpetuate customer experience via extensive data mining.

Market basket analysis is used:

  • To group certain items in specific groups;
  • To target them to the users who happened to be purchasing something out of a particular group.

The other element of the equation is differential analysis. It performs a comparison of specific data segments and defines the most effective option — for example, the lowest price in comparison with other marketplaces.

The result gives an insight into customers’ needs and preferences and allows them to adapt the surrounding service to fit it accordingly.

Business Analytics, Marketing – Forecasting / Predictive Analytics

Understanding what the future holds for your business operation is critical for effective management. It is the key to making the right decisions from a long-term perspective.

That’s what Predictive Analytics are for. Viable forecasts of possible outcomes can be realized through combinations of the supervised and unsupervised algorithm. The methods applied are:

  • Regression analysis;
  • Classification;
  • Clustering;
  • Association rules.

Here’s how it works: there is a selection of factors critical to your operation. Usually, it includes user-related segmentation data plus performance metrics.

These factors are connected with an ad campaign budget and also goal-related metrics. This allows us to calculate a variety of possible outcomes and plan out the campaign in the most effective way.

Business Analytics, HR analytics – Risk Management

The Decision-making process depends on a clear understanding of possible outcomes. Data mining is often used to perform a risk assessment and predict possible outcomes in various scenarios.

In the case of Business Analytics, this provides an additional layer for understanding the possibilities of different options.

In the case of HR Analytics, risk management is used to assess the suitability of the candidates. Usually, this process is built around specific criteria and grading (soft skills, technical skills, etc.)

This operation is carried out by composing decision trees that include various sequences of actions. In addition, there is a selection of outcomes that may occur upon taking them. Combined they present a comprehensive list of pros and cons for every choice.

Decision tree analysis is also used to assess the cost-benefit ratio.

Big Data and Data Mining Statistics 2018

Source: Statista

Data Mining Challenges

The scope of Data Sets

While it might seem obvious for big data, but the fact remains – there is too much data. Databases are getting bigger and it is getting harder to get around them in any kind of comprehensive manner.

There is a critical challenge in handling all this data effectively and the challenge itself is threefold:

  1. Segmenting data – recognizing important elements;
  2. Filtering the noise – leaving out the noise;
  3. Activating data – integrating gathered information into the business operation;

Every aspect of this challenge requires the implementation of different machine learning algorithms.

Privacy & Security

Data Mining operation directly deals with personally identifiable information. Because of that, it is fair to say that privacy and security concerns are a big challenge for Data Mining.

It is easy to understand why. Given the history of recent data breaches – there is certain distrust in any data gathering.

In addition to that, there are strict regulations regarding the use of data in the European Union due to GDPR. They turn the data collection operation on its head. Because of that, it is still unclear how to keep the balance between lawfulness and effectiveness in the data-mining operation.

If you think about it, data mining can be considered a form of surveillance. It deals with information about user behavior, consuming habits, interactions with ad content, and so on. This information can be used both for good and bad things. The difference between mining and surveillance lies in the purpose. The ultimate goal of data mining is to make a better customer experience.

Because of that, it is important to keep all the gathered information safe:

  • from being stolen;
  • from being altered or modified;
  • from being accessed without permission.

In order to do that, the following methods are recommended:

  • Encryption mechanisms;
  • Different levels of access;
  • Consistent network security audits;
  • Personal responsibility and clearly defined consequences of the perpetration.

Download Free E-book with DevOps Checklist

Download Now

Data Training Set

To provide a desirable level of efficiency of the algorithm – a training data set must be adequate for the cause. However, that is easier said than done.

There are several reasons for that:

  • Dataset is not representative. A good example of this can be rules for diagnosing patients. There must be a wide selection of use cases with different combinations in order to provide the required flexibility. If the rules are based on diagnosing children, the algorithm’s application to adults will be ineffective.
  • Boundary cases are lacking. Boundary case means detailed distinction of what is one thing and what is the other. For example, the difference between a table and a chair. In order to differentiate them, the system needs to have a set of properties for both. In addition to that, there must be a list of exceptions.
  • Not enough information. In order to attain efficiency, a data mining algorithm needs clearly defined and detailed classes and conditions of objects. Vague descriptions or generalized classification can lead to a significant mess in the data. For example, a definitive set of features that differentiate a dog from a cat. If the attributes are too vague – both will simply end up in the “mammal” category.

Data Accuracy

The other big challenge of data mining is the accuracy of the data itself. In order to be considered worthwhile, gathered data needs to be:

  • complete;
  • accurate;
  • reliable.

These factors contribute to the decision making process.

There are algorithms designed to keep it intact. In the end, the whole thing depends on your understanding of what kind of information you for which kind of operations. This will keep the focus on the essentials.

Data Noise

One of the biggest challenges that come while dealing with Big Data and Data Mining, in particular, is noise.

Data Noise is all the stuff that provides no value for the business operation. As such it must be filtered out so that the primary effort would be concentrated on the valuable data.

To understand what is noise in your case – you need to define what kind of information you need clearly, which forms a basis for the filtering algorithms.

In addition to that, there are two more things to deal with:

  • Corrupted attribute values
  • Missing attribute values

The thing with both is that these factors affect the quality of the results. Whether it is a prediction or segmenting – the abundance of noise can throw a wrench into an operation.

In case of corrupted values – it all depends on the accuracy of the established rules and the training set. The corrupted values come from inaccuracies in the training set that subsequently cause errors in the actual mining operation. At the same time, values that are worthwhile may be considered as noise and filtered out.

There are times when the attribute values can be missing from the training set and, while the information is there, it might get ignored by the mining algorithm due to being unrecognized. 

Both of these issues are handled by unsupervised machine learning algorithms that perform routine checks and reclassifications of the datasets.

What’s Next?

Data Mining is one of the pieces for the bigger picture that can be attained by working with Big Data. It is one of the fundamental techniques of modern business operation. It provides the material that makes possible productive work.

As such, its approaches are continually evolving and getting more efficient in digging out the insights. It is fascinating to see where technology is going.

Does your business need data mining solutions?

Let's discuss the details

What is Data Wrangling? Steps, Solutions, and Tools

These days almost anything can be a valuable source of information. The primary challenge lies in extracting the insights from the said information and make sense of it, which is the point of Big Data. However, you also need to prep the data at first, and that is Data Wrangling in a nutshell.

The nature of the information is that it requires a certain kind of organization to be adequately assessed. This process requires a crystal clear understanding of which operations need what sort of data.

Let’s look closer at wrangled data and explain why it is so important.

What Is Data Wrangling? Data Wrangling Definition

Data Wrangling process (also known as Data Munging) is the process of transforming data from its original “raw” form into a more digestible format and organizing sets from various sources into a singular coherent whole for further processing.

What is “raw data”? It is any repository data (texts, images, database records) that is documented but yet to be processed and fully integrated into the system.

The process of wrangling can be described as “digesting” data (often referred to as “munging” thus the alternative term “data wrangling techniques”) and making it useful (aka usable) for the system. It can be described as a preparation stage for every other data-related operation.

Wrangling the data is usually accompanied by Mapping. The term “Data Mapping” refers to the element of the wrangling process that involves identifying source data fields to their respective target data fields. While Wrangling is dedicated to transforming data, Mapping is about connecting the dots between different elements.

What is the Purpose of Data Wrangling?

The primary purpose of data wrangling can be described as getting data in coherent shape. In other words, it is making raw data usable. It provides the substance for further proceedings.

As such, Data Wrangling acts as a preparation stage for the data-mining process. Process-wise these two operations are coupled together as you can’t do one without another.

Overall, data wrangling covers the following processes:

  • Getting data from the various source into one place
  • Piecing the data together according to the determined setting
  • Cleaning the data from the noise or erroneous, missing elements

It should be noted that Data Wrangling is a somewhat demanding and time-consuming operation both from computational capacities and human resources. Data wrangling takes over half of what data scientist does.

On the upside, the direct result of this profound — data wrangling that’s done right makes a solid foundation for further data processing.

Data Wrangling Steps

Data Wrangling is one of those technical terms that are more or less self-descriptive. The term “wrangling” refers to rounding up information in a certain way.

This operation includes a sequence of the following processes:

  1. Preprocessing — the initial state that occurs right after the acquiring of data.
  2. Standardizing data into an understandable format. For example, you have a user profile events record, and you need to sort it by types of events and time stamps;
  3. Cleaning data from noise, missing, or erroneous elements.
  4. Consolidating data from various sources or data sets into a coherent whole. For example, you have an affiliate advertising network, and you need to gather performance statistics for the current stage of the marketing campaign;
  5. Matching data with the existing data sets. For example, you already have user data for a certain period and unite these sets into a more expansive one;
  6. Filtering data through determined settings for the processing.

Data Wrangling Machine Learning Algorithms

Overall, there are the following types of machine learning algorithms at play:

  • Supervised ML algorithms are used for standardizing and consolidating disparate data sources:
    • Classification is used to identify known patterns;
    • Normalization is used to flatten the independent variables of data sets and restructure data into a more cohesive form.
  • Unsupervised ML algorithms are used for the exploration of unlabeled data:

PREDICTIVE ANALYTICS VS. MACHINE LEARNING: WHAT IS THE DIFFERENCE

How Data Wrangling solves major Big Data / Machine Learning challenges?

Data Exploration

The most fundamental result of data mapping in the data processing operation is exploratory. It allows you to understand what kind of data you have and what you can do with it.

While it seems rather apparent — more often than not this stage is skewed for the sake of seemingly more efficient manual approaches.

Unfortunately, these approaches often leave out and miss a lot of valuable insights into the nature and the structure of data. In the end, you will be forced to redo the thing properly to make possible further data processing operations.

Automated Data Wrangling goes through data in more ways and presents many more insights that can be worthwhile for business operation.

DATA MINING VS. PREDICTIVE ANALYTICS: KNOW THE DIFFERENCE

Unified and Structured Data

It is fair to say that data always comes in as a glorious mess in different shapes and forms. While you may have a semblance of comprehension of “what it is” and “what it is for” — data, as it is in its original form, raw data is mostly useless if it is not organized correctly beforehand.

Data Wrangling and subsequent Mapping segments and frames data sets in a way that would best serve its purpose of use. This makes datasets freely available for extracting any insights for any emerging task.

On the other hand, clearly structured data allows combining multiple data sets and gradually evolve the system into more effective.

How to make your IT project secured?

Download Secure Coding Guide

Data Clean-up from Noise / Errors / Missing Information

Noise, errors, and missing values are common things in any data set. There are numerous reasons for that:

  • Human error (so-called soapy eye);
  • Accidental Mislabeling;
  • Technical glitches;

Its impact on the quality of the data processing operation is well-known — it leads to poorer quality of results and subsequently less effective business operation. For the machine learning algorithms noisy, inconsistent data is even worse. If the algorithm is trained in such datasets — it can be rendered useless for its purposes.

This is why data wrangling is there to right the wrongs and make everything the way it was supposed to be.

Get Your ML/Big Data Challenges Tackled within 24 Hours

Find Out More

In the context of data cleaning, wrangling is doing the following operations:

  • Data audit — anomaly and error/contradiction detection through statistical and database approaches.
  • Workflow specification and execution — the causes of anomalies and errors are analyzed. After specifying their origin and effect in the context of the specific workflow — the element is then corrected or removed from the data set.
  • Post-processing control — after implementing the clean-up — the results of the cleaned workflow are reassessed. In case if there are further complications — a new cycle of cleaning may occur.

Minimized Data Leakage

Data Leakage is often considered one of the biggest challenges of Machine Learning. And since ML algorithms are used for data processing — the threat grows exponentially. The thing is — prediction relies on the accurateness of data. And if the calculated prediction is based on uncertain data — this prediction is as good as a wild guesstimation.

What is Data Leakage? The term refers to instances when the training of the predictive model uses data outside of the training data set. So-called “outside data” can be anything unverified or unlabeled for the model training.

The direct result of this is an inaccurate algorithm that provides you with incorrect predictions that can seriously affect your business operation.

Why does it happen? The usual cause is a messy structure of the data with no clear border signifiers where is what and what is for what. The most common type of data leakage is when data from the test set bleeds into the training data set.  

Extended Data Wrangling and Data Mapping practices can help to minimize its possibility and subsequently neuter its impact.

Data Wrangling Tools

Basic Data Munging Tools

Data Wrangling in Python

  1. Numpy (aka Numerical Python) — the most basic package. Lots of features for operations on n-arrays and matrices in Python. The library provides vectorization of mathematical operations on the NumPy array type, which improves performance and accordingly speeds up the execution.
  2. Pandas — designed for fast and easy data analysis operations. Useful for data structures with labeled axes. Explicit data alignment prevents common errors that result from misaligned data coming in from different sources.
  3. Matplotlib — Python visualization module. Good for line graphs, pie charts, histograms, and other professional grade figures.
  4. Plotly — for interactive, publication-quality graphs. Excellent for line plots, scatter plots, area charts, bar charts, error bars, box plots, histograms, heatmaps, subplots, multiple-axis, polar graphs, and bubble charts.
  5. Theano — library for numerical computation similar to Numpy. This library is designed to define, optimize, and evaluate mathematical expressions involving multi-dimensional arrays efficiently.

Data Wrangling in R

  1. Dplyr – essential data-munging R package. Supreme data framing tool. Especially useful for data management operating by categories.
  2. Purrr – good for list function operations and error-checking.
  3. Splitstackshape – an oldie but goldie. Good for shaping complex data sets and simplifying the visualization.
  4. JSOnline – nice and easy parsing tool.
  5. Magrittr – good for wrangling scattered sets and putting them into a more coherent form.

Conclusion

Staying on your path in the forest of information requires a lot of concentration and effort. However, with the help of machine learning algorithms, the process becomes a lot simpler and manageable. 

When you gain insights and make your business decisions based on them, you gain a competitive advantage over other businesses in your industry. Yet, it doesn’t work without doing the homework first and that’s why you need data wrangling processes in place. 

Build Your Own Dedicated Team

Guide to Supervised Machine Learning

The competitive advantage of any company is built upon insights. Understanding what the information holds for you is one of the most vital requirements for business success.

Supervised Machine Learning paves the way for understanding uneven, hidden patterns in data by transforming raw data into the menagerie of insights that show you how to move forward and accomplish your goals.

The secret of the successful use of machine learning lies in knowing what exactly you want it to do. In this article, we will take a closer look at business applications of supervised learning algorithms.

What Is Supervised Machine Learning?

Supervised learning is a type of machine learning algorithm that looks for the unknown in the known. 

For example, you have known input (x) and output (Y). A simplified supervised machine learning algorithm would look like an equation:

Y = f(x)

Where your goal is to train your model in such a way that you would be able to tell what kind of Y would you get if you change x. In less technical terms, it is an algorithm designed to sort through the data and squeeze the gist of it in the process so that you could understand what the future holds for you.

Supervised machine learning applications are all about:

  • Scaling the scope of data;
  • Uncovering the hidden patterns in the data;
  • Extracting the most relevant insights;
  • Discovering relationships between entities;
  • Enabling predictions of the future outcomes based on available data;

How does it work?

The supervised learning algorithm is trained on a labeled dataset, i.e., the one where input and output are clearly defined.

Data Labeling means:

  • Defining an input – the types of information in the dataset that the algorithm is trained on. It shows what types of data are there and what are their defining features;
  • Defining an output – labeling sets the desired results for the algorithm. It determines the articulation of the algorithm with the data (for example, matching data on “yes/no” or “true/false” criteria).

The labeled dataset contains everything the algorithm needs to operate while setting the ground rules. The training process consists of 80% of training data and 20% of testing data.

With clearly determined values, the “learning” process is enabled, and the algorithm can “understand” what it is supposed to be looking for. From the algorithm’s perspective, the whole process turns into something akin to a “connect the dots” exercise.

Now let’s look at two fundamental processes of supervised machine learning – classification and regression.

Classification – Sorting out the Data

Classification is the process of differentiating and categorizing the types of information presented in the dataset into discrete values. In other words, it is the “sorting out” part of the operation.

Here’s how it works:

  1. The algorithm labels the data according to the input samples on which the algorithm was trained.
  2. It recognizes certain types of entities, looks for similar elements, and couples them into relevant categories.
  3. The algorithm is also capable of detecting anomalies in the data.

The classification process covers optical character or image recognition, and also binary recognition (whether a particular bit of data is compliant or non-compliant to certain requirements in a manner of “yes” or “no”).

Regression – Calculating the Possibilities

Regression is the part of supervised learning that is responsible for calculating the possibilities out of the available data. It is a method of forming the target value based on specific predictors that point out cause and effect relations between the variables.

The process of regression can be described as finding a model for distinguishing the data into continuous real values. In addition to that, a regression can identify the distribution movement derived from the part data.

The purpose of regression is:

  • To understand the values in the data
  • To identify the relations or patterns between them.
  • To calculate predictions of certain outcomes based on past data.

Examples of supervised machine learning

[Source]

Decision Trees – Sentiment Analysis & Lead Classification

Decision trees are a primary form of organizing the operation in machine learning, which can be used both for classification and regression models. The decision tree breaks down the dataset into exponentially smaller subsets with a deeper definition of an entity. It provides the algorithm with the decision framework.

Structure-wise, decision trees are comprised of branches with different options (nodes) going from general to specific. Each branch constitutes a sequence based on compliance with the node requirements.

Usually, the requirements of the nodes are formulated as simple as “yes” and “no”. The former enables further proceeding while the latter signifies the conclusion of the operation with the desirable result.

The depth of the decision tree depends on the requirements of the particular operation. For example, the algorithm should recognize the images of apples out of the dataset. One of the primary nodes is based on the color “red,” and it asks whether the color on the image is red. If “yes” the sequence moves on. If not – the image is passed on.

Overall, decision trees use cases include:

  • Customer’s Sentiment Analysis
  • Sales Funnel Analysis

See also: Why Business Applies Sentiment Analysis

Linear Regression – Predictive Analytics

Linear Regression is the type of machine learning model that is commonly used to get insight out of available information.

It involves determining the linear relationship between multiple input variables and a single output variable. The output value is calculated out of a linear combination of the input variables.

There are two types of linear regression:

  1. Simple linear regression – with a single independent variable used to predict the value of a dependent variable
  2. Multiple linear regression – with numerous independent variables used to predict the output of a dependent variable.

It is a nice and simple way of extracting an insight into data.

Examples of linear regression include:

  • Predictive Analytics
  • Price Optimization (Marketing and sales)
  • Analyzing sales drivers (pricing, volume, distribution, etc.)

[Source]

Logistic Regression – Audience Segmentation and Lead Classification

Logistic regression is similar to linear regression, but instead of a numeral dependent variable, it uses a different type of variables, most commonly binary “yes/no” / “true/false” variations.

Its primary use case is for binary prediction. For example, it is used by insurance companies to determine whether to give a credit card to the customer or decline.

Logistic Regression also involves certain elements of classification in the process as it classifies the dependent variable into one of the available classes.

Business examples of logistic regression include:

  • Classifying the contacts, leads, customers into specific categories
  • Segmenting target audience based on relevant criteria
  • Predicting various outcomes out of input data

Random Forest Classifier – Recommender Engine, Image Classification, Feature Selection

Random Forest Classifier is one of the supervised machine learning use cases that apply the decision trees.

It creates a sequence of decision trees based on a randomly organized selection from the training dataset. Then it gathers the information from the other decision trees so that it could decide on the final class of the test object.

The difference from the traditional decision trees is that random forest applies an element of randomness to a bigger extent than usual. Instead of simply looking for the most important feature upon the node split, it tries to find the best feature in the random selection of features.

This brings a large degree of diversity to the model and can seriously affect the quality of its work.

Deep decision trees may suffer from overfitting, but random forests avoid overfitting by making trees on random subsets. It takes the average of all the predictions, which cancels out the biases.

Random Forest Classifier use cases include:

  • Content Customization according to the User Behavior and Preferences
  • Image recognition and classification
  • Feature selection of the datasets (general data analysis)

Gradient Boosting Classifier – Predictive Analysis

Gradient Boosting Classifier is another method of making predictions. The process of boosting can be described as a combination of weaker (less accurate) learners into a stronger whole.

Instead of creating a pool of predictors, as in bagging, boosting produces a cascade of them, where each output is the input for the following learner.  It is used to minimize prediction bias.

Gradient boosting takes a sequential approach to obtain predictions. In gradient boosting, each decision tree predicts the error of the previous decision tree — thereby boosting (improving) the error (gradient).

Gradient Boosting is widely used in sales, especially in the retail and eCommerce sectors. The use cases include:

  • Inventory Management
  • Demand Forecasting
  • Price Prediction.

Support Vector Machines (SVM) – Data Classification

Support Vector Machines (aka SVM) is a type of algorithm that can be used for both Regression and Classification purposes.

At its core – it is a sequence of decision planes that define the boundaries of the decision. Different planes signify different classes of entities.

The algorithm performs classification by finding the hyperplane (a unifying plane between two or more planes) that maximizes the margin between the two classes with the help of support vectors. This shows the features of the data and what they might mean in a specific context.

Support Vector Machines algorithms are widely used in ad tech and other industries for:

  • Segmenting audience
  • Managing ad inventory
  • Providing a framework for understanding the possibilities of conversions in the specific audience segments of the particular types of ads.
  • Text Classification

Naive Bayes – Sentiment Analysis

Naive Bayes classifier is based on Bayes’ theorem with the independence assumptions between predictors, i.e., it assumes the presence of a feature in a class is unrelated to any other function. Even if these features depend on each other or upon the existence of the other elements, all of these properties work independently. Thus, the name Naive Bayes.

It is used for classification based on the normal distribution of data.

The Naive Bayes model is easy to build, with no complicated iterative parameter estimation which makes it particularly useful for very large datasets.

Naive Bayes use cases include:

  • Data Classification (such as spam detection)
  • Lead Classification
  • Sentiment Analysis (based on input texts, such as reviews or comments)

Conclusion

The vast majority of business cases for machine learning use supervised machine learning algorithms to enhance the quality of work and understand what decision would help to reach the intended goal.

As we have seen in this article, numerous business areas can benefit from the implementation of ML – sales and marketing, CEOs, and business owners, the list goes on. 

You’ve got business data, so make the most of it with machine learning. 

Guide to Unsupervised Machine Learning: 7 Real Life Examples

The effective use of information is one of the prime requirements for any kind of business operation. At some point, the amount of data produced goes beyond simple processing capacities. That’s where machine learning algorithms kick in.

However, before any of it could happen – the information needs to be explored and made sense of. That is what unsupervised machine learning is for in a nutshell.

We had talked about supervised ML algorithms in the previous article. In this one, we’ll focus on unsupervised ML and its real-life applications. 

What is unsupervised machine learning?

Unsupervised learning is a type of machine learning algorithm that brings order to the dataset and makes sense of data.

Unsupervised machine learning algorithms are used to group unstructured data according to its similarities and distinct patterns in the dataset.

The term “unsupervised” refers to the fact that the algorithm is not guided like a supervised learning algorithm.

How does an unsupervised ML algorithm work?

The unsupervised algorithm is handling data without prior training – it is a function that does its job with the data at its disposal. In a way, it is left at his own devices to sort things out as it sees fit.  

The unsupervised algorithm works with unlabeled data. Its purpose is exploration. If supervised machine learning works under clearly defines rules, unsupervised learning is working under the conditions of results being unknown and thus needed to be defined in the process.

The unsupervised machine learning algorithm is used to:

  1. Explore the structure of the information and detect distinct patterns;
  2. Extract valuable insights;
  3. Implement this into its operation in order to increase the efficiency of the decision-making process

In other words, it describes information – go through the thick of it and identifies what it really is.

In order to make that happen, unsupervised learning applies two major techniques – clustering and dimensionality reduction.

Clustering – Exploration of Data

“Clustering” is the term used to describe the exploration of data, where similar pieces of information are grouped. There are several steps to this process:

  • Defining the credentials that form the requirement for each cluster. The credentials are then matched with the processed data and thus the clusters are formed.  
  • Breaking down the dataset into specific groups (known as clusters) based on their common features.

Clustering techniques are simple yet effective. They require some intense work yet can often give us some valuable insight into the data.

[Source]

Clustering has been widely used across industries for years:

  • Biology – for genetic and species grouping;
  • Medical imaging – for distinguishing between different kinds of tissues;
  • Market research – for differentiating groups of customers based on some attributes
  • Recommender systems – giving you better Amazon purchase suggestions or Netflix movie matches.

Dimensionality Reduction – Making Data Digestible

In a nutshell, dimensionality reduction is the process of distilling the relevant information from the chaos or getting rid of the unnecessary information.

Raw data is usually laced with a thick layer of data noise, which can be anything – missing values, erroneous data, muddled bits, or something irrelevant to the cause. Because of that, before you start digging for insights, you need to clean the data up first. Dimensionality reduction helps to do just that. 

Dimensionality reduction

[Source]

From the technical standpoint – dimensionality reduction is the process of decreasing the complexity of data while retaining the relevant parts of its structure to a certain degree.

7 Unsupervised Machine Learning Real Life Examples

k-means Clustering – Data Mining

k-means clustering is the central algorithm in unsupervised machine learning operations. It is the algorithm that defines the features present in the dataset and groups certain bits with common elements into clusters.

k-mean-algorithm.

[Source]

As such, k-means clustering is an indispensable tool in the data-mining operation. It is also used for:

  • Audience segmentation
  • Customer persona investigation
  • Anomaly detection (for example, to detect bot activity)
  • Pattern recognition (grouping images, transcribing audio)
  • Inventory management (by conversion activity or by availability)

Hidden Markov Model – Pattern Recognition, Natural Language Processing, Data Analytics

Another example of unsupervised machine learning is the Hidden Markov Model. It is one of the more elaborate ML algorithms – a statical model that analyzes the features of data and groups it accordingly.

Hidden Markov Chain

[Source]

Hidden Markov Model is a variation of the simple Markov chain that includes observations over the state of data, which adds another perspective on the data gives the algorithm more points of reference.

Hidden Markov Model real-life applications also include:

  • Optical Character recognition (including handwriting recognition)
  • Speech recognition and synthesis (for conversational user interfaces)
  • Text Classification (with parts-of-speech tagging)
  • Text Translation

Hidden Markov Models are also used in data analytics operations. In that field, HMM is used for clustering purposes. It finds the associations between the objects in the dataset and explores its structure. Usually, HMM are used for sound or video sources of information.

Need help in developing your App?

Reach out

DBSCAN Clustering – Customer Service Personalization, Recommender engines

DBSCAN Clustering AKA Density-based Spatial Clustering of Applications with Noise is another approach to clustering. It is commonly used in data wrangling and data mining for the following activities:

  • Explore the structure of the information
  • Find common elements in the data
  • Predict trends coming out of data

Overall, DBSCAN operation looks like this:

  • The algorithm groups data points that are close to each other.
  • Then it sorts the data according to the exposed commonalities
DBSCAN Clustering

[Source]

DBSCAN algorithms are used in the following fields:

  • Targeted Ad Content Inventory Management
  • Customer service personalization
  • Recommender Engines

I want a free consultation for my project

Contact Us

Principal component analysis (PCA) – Data Analytics Visualization / Fraud Detection

PCA is the dimensionality reduction algorithm for data visualization. It is a sweet and simple algorithm that does its job and doesn’t mess around. In the majority of cases is the best option.

In its core, PCA is a linear feature extraction tool. It linearly maps the data about the low-dimensional space.

Principal component analysis (PCA)

[Source]

PCA combines input features in a way that gathers the most important parts of data while leaving out the irrelevant bits.

As a visualization tool – PCA is useful for showing a bird’s eye view on the operation. It can be an example of an excellent tool to:

  • Show the dynamics of the website traffic ebbs and flows.
  • Break down the segments of the target audience on specific criteria

t-SNE – Data Analytics Visualization

t-SNE AKA T-distributed Stochastic Neighbor Embedding is another go-to algorithm for data visualization.

t-SNE uses dimensionality reduction to translate high-dimensional data into low-dimensional space. In other words, show the cream of the crop of the dataset.  

t-SNE

[Source]

The whole process looks like this:

  • The algorithm counts the probability of similarity of the points in a high-dimensional space.
  • Then it does the same thing in the corresponding low-dimensional space.
  • After that, the algorithm minimizes the difference between conditional probabilities in high-dimensional and low-dimensional spaces for the optimal representation of data points in a low-dimensional space.

As such, t-SNE is good for visualizing more complex types of data with many moving parts and everchanging characteristics. For example, t-SNE is good for:

  • Genome visualization in genomics application
  • Medical test breakdown (for example, blood test or operation stats digest)
  • Complex audience segmentation (with highly detailed segments and overlapping elements)

Singular value decomposition (SVD) – Recommender Systems

Singular value decomposition is a dimensionality reduction algorithm used for exploratory and interpreting purposes.

It is an algorithm that highlights the significant features of the information in the dataset and puts them front and center for further operation. Case in point – making consumer suggestions, such as which kind of shirt and shoes fit best with those ragged Levi’s jeans.

Singular value decomposition (SVD)

[Source]

In a nutshell, it sharpens the edges and turns the rounds into tightly fitting squares. In a way, SVD is reappropriating relevant elements of information to fit a specific cause.

SVD can be used:

  • To extract certain types of information from the dataset (for example, take out info on every user located in Tampa, Florida).
  • To make suggestions for a particular user in the recommender engine system.
  • To curate ad inventory for a specific audience segment during real-time bidding operation.

Association rule – Predictive Analytics

Association rule is one of the cornerstone algorithms of unsupervised machine learning.

It is a series of techniques aimed at uncovering the relationships between objects. This provides a solid ground for making all sorts of predictions and calculating the probabilities of certain turns of events over the other.

While association rules can be applied almost everywhere, the best way to describe what exactly they are doing are via eCommerce-related example.

There are three major measure applied in association rule algorithms

  • Support measure shows how popular the item is by the proportion of transaction in which it appears.
  • Confidence measure shows the likeness of Item B being purchased after item A is acquired.
  • Lift measure also shows the likeness of Item B being purchased after item A is bought. However, it adds to the equation the demand rate of Item B.

Conclusion

The secret of gaining a competitive advantage in the specific market is in the effective use of data. Unsupervised machine learning algorithms help you segment the data to study your target audience’s preferences or see how a specific virus reacts to a specific antibiotic. 

Real-life applications abound and our data scientists, engineers, and architects can help you define your expectations and create custom ML solutions for your business. 

Need help in developing your App?

Reach out

How eCommerce uses Machine Learning Applications


Ever since eCommerce became a valid buying option for customers in the late 90s – it continues to rapidly grow with 3.45T in projected sales in 2019.  

Ever since eCommerce became a valid buying option for the customers in the late 90s - it continues to rapidly grow with $3.45T in projected sales in 2019.

 The online retail industry adopts all sorts of technological innovations, including big data and machine learning, and apply them in various use cases. The proximity of user data and the variety of use cases contributed a lot to bring these technologies to the level they are today. 

Now, AI in eCommerce (with marketing ad tech) is one of the leading fields that perfect machine learning algorithms for the benefit of superior customer experience.

Such eCommerce machine learning applications as service personalization, sentiment analysis, image classification, and conversational interfaces (chatbots) getting the first experience in the fields of eCommerce marketplaces. 

In this article, we will look at major big data eCommerce artificial intelligence applications and explain how they all improve the flow of business operation.

WHAT IS AI IN HEALTHCARE?

How to use Machine Learning in eCommerce 

1. Product Feed Recommender Engine

Have you ever thought about why Amazon can guess which products may interest you? It is simple. Amazon has a recommender engine that analyses user search results and proposes relevant recommendations 

Recommender engines work on user data, the Holy Grail of all sorts of consumer insights in big data eCommerce. 

Throughout the numerous sessions of different users, the algorithm gathers the information and clusters patterns. It creates a cohesive picture of what kind of content and products a particular customer segment likes and prefers. 

This information is then clustered and classified by machine learning algorithms into a foundation for further recommendations. For example, if the user is looking for calligraphy kits, his query is matched with the similar from the relevant target audience segment. 

PREDICTIVE ANALYTICS VS. MACHINE LEARNING: WHAT IS THE DIFFERENCE

From a technical standpoint, the recommender engine is a combination of:

  • Clustering unsupervised algorithms;
  • Classification supervised algorithms;
  • Predictive algorithm for suggestions;

The methodology of the recommender engine is the following: 

  • Processing user data and extracting preference insights;  
  • Matching insights with the product (or content overall) database;
  • Calculating the probability grid of which kinds of products may be more relevant to a particular user.

As a result, the recommender engine creates an infinite loop in which the user gets content and products that are relatively relevant to its cause and buys even more products. And when the user inputs something new – it is also taken into the equation and subsequently implemented into the recommendation sequence. 

This is how Amazon generates 35% of their revenue. Similarly, Best Buy saw an increase in 23,7% after implementing their recommendation system.

This is how Amazon generates 35% of its revenue. Similarly, Best Buy saw an increase of 23,7% after implementing its recommendation system. Currently, recommender engine features are available for custom use on platforms like Shopify and Magento.    

If you want to know more about recommender engines – check out this article.

Download free eBook on eCommerce app development

Download now

2. Service Personalization / Content Feed Personalization

Automation of the various routines is one of the many benefits of machine learning. 

A great example of this is personalization. The machine learning models for eCommerce can adjust the entire marketplace appearance to meet a particular customer.

The primary motivation behind personalization with AI in eCommerce is user engagement that results in a more attractive and practical customer experience (with more conversions and sales). Marketplaces want users to spend more time and made purchases on their platforms. To make it happen, they reshape some aspects of the website to fit the needs of the particular user. The numbers don’t lie – around 48% of customers appreciate when things are adjusted to their preferences and 74% of online shoppers are disappointed if the online store product feed does not provide them with personalized recommendations. 

Previously, personalization on eCommerce marketplaces required adapting pages and product selection by the context of the particular page or request without using customer data. Now, a couple of algorithms are handling the personalization process. 

DOES YOUR BUSINESS REALLY NEED AN ENTERPRISE ARTIFICIAL INTELLIGENCE

From a technical point of view, service personalization is an expanded application of the recommender engine. 

The difference is that instead of slightly adjusting the product feed and related suggestions to the user segment patterns – the entire layout of the marketplace is tailored to the expressed preferences of the particular user. 

The key to successful service personalization is seamless implementation into the user experience. In other words, from the user’s side, personalization comes naturally. 

The foundation of service personalization is within user data patterns. Everything counts for this kind of customization:

  • Product purchases; 
  • Product filtering (color, size, type, etc.) 
  • “For later” and “wishlist” listings;
  • Product searches and Product views;
  • Product rating;
  • Blog views;
  • Comments, product reviews;
  • Interactions with ads;
  • Interactions with “you might also like” and “people also buy” sections;
  • Even cart abandonment says something about the user;

This information is clustered and classified by a combination of supervised and unsupervised machine learning algorithms and later matched with the website’s database to bring to the forth more relevant stuff.

THE ROLE OF AI AND MACHINE LEARNING IN DIGITAL BIOLOGY

The process includes:

  1. Personalized product feed;
  2. Related suggestions;
  3. Relevant special offers;
  4. Targeted ads; 

Service personalization results in a more focused user experience that avoids possible distractions, cart abandonment, and irrelevant products while emphasizing the stuff that interests the user. 

ARTIFICIAL INTELLIGENCE IN ECOMMERCE: THE BEST USAGE AND TOOLS

3. Dynamic Price adjustment – Predictive Analytics

Price adjustment is the field where you can feel the scope of the benefits of machine learning. eCommerce is one of those industries where competition is beyond fierce, especially when it comes to niche consumer segments such as beauty products or hardware. Because of that, it is crucial to get as many advantages as possible to attract and retain customers. 

Enter machine learning.

One of the most effective ways of doing that is by offering more competitive prices for the products of interest. This option is made possible by significant big data eCommerce machine learning price monitoring and adjustment. According to the BigCommerce study, price is one of the major drivers for 47% of the customers in eCommerce. So it makes sense to tweak in the right way.

For example, Amazon uses price adjustment based on external trends and product demand and also internal user data (which is also used for product recommendation). This allows them to subtly make the prices for the products more appealing to the customers interested in them. 

Amazon price adjustment analyses prices on other online stores

Let’s look at another example, Walmart uses price adjustment for customer retention. Their system is all about monitoring the competition and making their own prices look lower in comparison.  

Here’s how the price adjustment system works:

 Walmart uses price adjustment for customer retention.
  • There are three key sources of information:
  1. Marketplace data itself;
  2. General user trends and demands;
  3. A network of competing marketplaces with the related products and target audience segments. 
  • There are regular checks of the prices for the products on the competing marketplaces. The comparison of this information with the prices on your marketplace.
  • Then this information is combined with general user trends and demands. 
  • Then the predictive algorithm calculates the best possible price change for the particular target audience segment. 

In addition to the straightforward competition, the price adjustment is often used to decrease customer churn on a particular online retail shop. 

In this case, the method is more straightforward – it includes the price for the product and user trends. The result is more attractive prices for low demand products that cause the renewal of the customer interest. 

TOP AI USE CASES IN SUPPLY CHAIN OPTIMIZATION

4. Supply and Demand Prediction Using Machine Learning

Supply and demand prediction is the evolution of price adjustment combined with the recommender engine. There are various products the interest for which spikes at a specific time, and this is a perfect reason to take advantage of it. According to Statista, the 2017 winter holidays generated over 8.2 billion worth of eCommerce sales in the United States.

The challenge comes with the management of the product inventory. It is essential to retain smooth processes when the trend is at the peak. The main problems of supply and demand are: 

  • Lack of products that satisfy the specific demand;
  • Insufficient quantity of the products that meet the particular demand.

As a result, companies are losing up to 25% of the monthly revenue due to unpredictable spikes of demands and lacking availability of the product. 

Predictive machine learning algorithms solve both problems. Here’s how it works:

The reaction to product demand variation adds the world outside to the equation. There are general trends and patterns of product demands available in public sources (Google Trends, etc.).

Then there are internal stats of product demand and customer purchase patterns.

This information is combined and laid out on the product inventory. You can see which product supply needs a boost and which products are lacking. 

With this information, you can optimize the process and deliver a satisfying customer experience.

BEST USE CASES OF ARTIFICIAL INTELLIGENCE IN THE TRANSPORTATION INDUSTRY

There are two significant types of product demand – seasonal and incidental. 

  • Seasonal demand – like Christmas-related products around Christmas. In this case, you can predict supply and demand prediction in hindsight and then optimize it on the spot.  
  • Incidental demand – Chernobyl-related content because of HBO Mini-series. Barnes and Noble used the interest spike to promote books on radiation-related topics with a revenue increase of up to 15%.

As a result, with the assistance of machine learning, the eCommerce marketplace can easily manage a system of discounts for specific products to satisfy the product demand and attract more customers with more reasonable prices.

5. Machine Learning for Visual Search 

Visual search and image recognition technology had greatly benefitted from the adoption of mobile eCommerce shopping. The reason for its growing popularity is simple. 

Unlike alphanumeric search engines that require specific information to deliver the desired result – all you need for a coherent visual search is an image of a thing the user is searching for. Everything else is handled by an image recognition engine that matches input information with the product database and selects the closest matches. 

Visual search streamlines customer journey towards the purchase, especially for the clothes and make-up segment. For example, Beauty.com had increased its sales by 15% since implementing visual search features.

implementing visual search features, Beauty.com had increased its sales by 15%

Here’s how it works:

  • There is an image recognition algorithm at play. It is used to define an image and describe its surface features. Usually, the process involves a convolutional neural network to recognize an image and a recurrent neural network to describe an image further.
  • Then the image description is combined with the product information.
  • When the search engine processes the image input – it matches the image descriptions and goes to the product information related to it. 

These days, there are two significant proponents of visual search commerce – Amazon and Pinterest. 

While Amazon is using visual search as an additional feature to the core search engine, Pinterest is using it as a core feature with the image coming before the product information. This approach embraces more natural product discovery and as a result, more engaging use of the application.

HOW ARTIFICIAL INTELLIGENCE AND MACHINE LEARNING ARE CHANGING THE POST-COVID BEAUTY AND COSMETICS INDUSTRY?

6. Fraud Detection and Prevention Opportunities for eCommerce

Fraud is one of the eCommerce’s biggest banes. Just last year the eCommerce industry had lost more than billions on various fraud schemes. It is one of the problems that never really goes away – you can find a way to eliminate present threats, and later it will adapt and come back with the new bag of tricks.

Hopefully, with an adoption of AI in eCommerce and implementation of specialized Machine Learning algorithms – predictive analytics are capable of detecting suspicious activity and preventing it from causing damage.

Let’s look at how eCommerce machine learning algorithms handle main fraud threats:

  • Return to Origin fraud. This fraud is an abuse of refund policy. In this case, the fraud detection algorithm analyzes user activity and its patterns and compares it with the frequent cases of refund. Insufficient periods between order and refund usually, expose this trick. 
  • Promo Code Abuse – when scammers create multiple accounts and apply the promo code on orders. In this case, there is anomaly detection and signal source analysis. Usually, this type of scam is performed by low-level criminals without intricate networks of the cover-up. Because of that, similar IP addresses expose this type of fraud. In other cases, promo code abusers are exposed by their behavioral patterns. 
  • Account Takeover. It is one of the more sophisticated types of eCommerce fraud. In this case, external phishing techniques gain access to the user account. The most common method is by installing malware through malicious links. Then fraudster takes over the account and performs purchases as he pleases. Anomaly detection algorithm combined with behavioral patterns combined with additional stages of identity verification (including location, IP, device, etc.) are used to expose and prevent this from happening.

7. Chatbots and conversational interfaces

Chatbots are all the rage right now. In a couple of years, chatbots had managed to evolve from the clumsy ELIZA-styled fancy interfaces to the competent multi-purpose assistants that cover everything from customer support to lead generation. 

With the wide adoption of smartphones and voice-control, the implementation of conversational interfaces to the big data eCommerce marketplaces became a necessity. The key benefits of implementing a conversational interface to the eCommerce store are functional versatility and streamlining of the finding and purchasing of products. In a way, a conversational UI chatbot is the ultimate customer service application. 

The bot can help the user to:

  • Find or suggest relevant products;
  • Compare the qualities of the products;
  • Proceed with the payments;
  • Arrange shopping lists.

At its core, eCommerce machine learning conversational UI use speech recognition algorithms and semantic search natural language processing algorithms. 

  • First, the transcription of the input speech happens. In the case of textual input – it is processed directly.
  • Then the transcribed text is processed and deconstructed to critical elements. Topic modeling, named-entity recognition, and intent analysis algorithms are applied.
  • This process lays the groundwork for determining the request. 
  • Then the algorithm uses available input information and semantic search to find matching credentials in the internal database. The results are arranged by probability and delivered as output. 

If the information is insufficient – a chatbot can ask additional questions regarding aspects of the product or the nature of the query. For example, Nike is using chatbots to simplify finding a fitting product (mixed with special offers and discounts). 

For example, Nike uses a chatbot to improve the product search.

On the other hand, Lego is using a chatbot to make relevant suggestions on gifts.

Another example is Lego chatbot, which makes relevant suggestions on gifts.

If you want to read more about conversational UI – check out this article.

Want to Learn More About The APP Solutions Approaches In Project Development?

Download Free Ebook

Conclusion

AI and machine learning for eCommerce seems to be a perfect combination in which both parties benefit from being with each other. 

The role of artificial intelligence in eCommerce is to make the buyers’ journey more comfortable and more efficient with various machine learning algorithms.

eCommerce is an industry where applications of machine learning directly contribute to the quality of the customer experience and business growth. 

Are you ready to apply machine learning in your online store? Fill in the contact form, and we will get in touch.

Want to receive reading suggestions once a month?

Subscribe to our newsletters